
Overview
My Performance is your personal dashboard for tracking how you spend your time across projects and clients. It shows detailed breakdowns of hours you've logged, organized by project, client, role, and other categories. Use this page to monitor your productivity, understand your billing patterns, and identify how your time is distributed.
Access My Performance by clicking the My performance link in the top navigation bar.
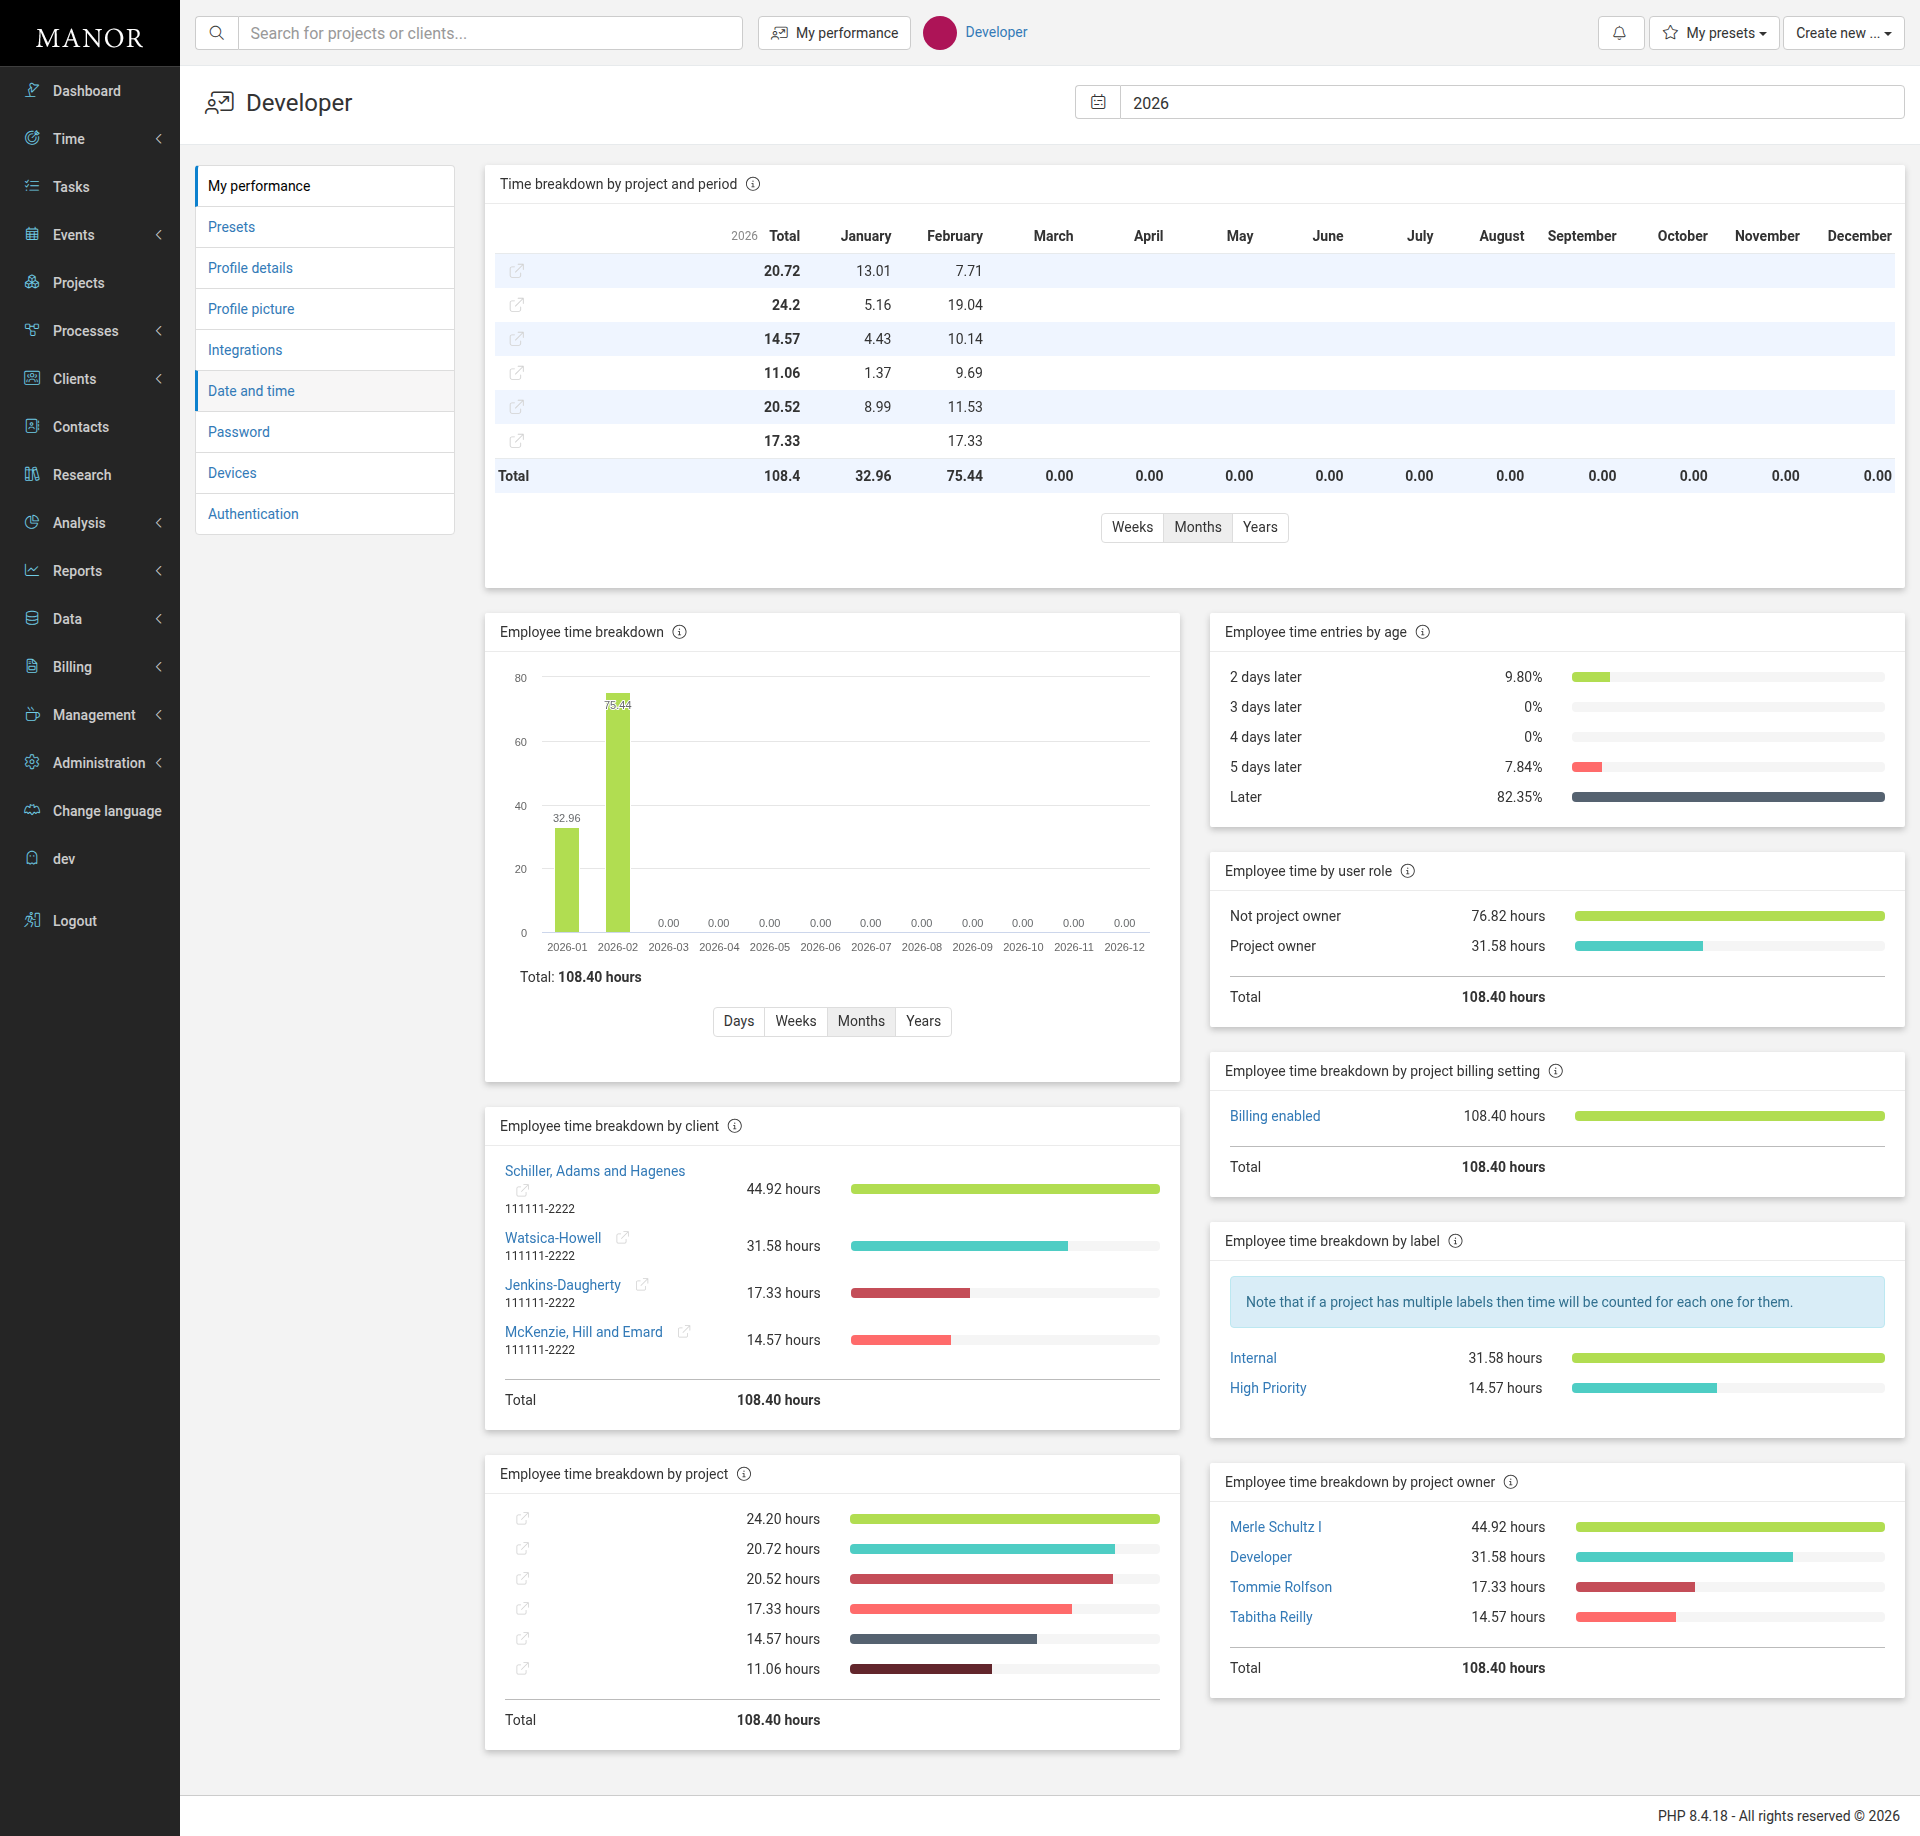
The page displays a comprehensive view of your time tracking data with multiple visualizations and breakdowns organized in sections below the main controls.
Understanding the Time Breakdown
My Performance displays your logged hours through multiple lenses, helping you understand where your time goes:
Time Breakdown by Project and Period
This section shows your hours organized by project over the selected time period as a data table with monthly columns. When you have logged time, you'll see which projects consumed the most hours, with a total row at the bottom.
Employee Time Breakdown
The central chart displays your total hours logged by month (or day/week/year, depending on your time resolution selection). The chart includes:
- Monthly columns - Each bar represents hours logged in that month
- Total hours - Summary showing your total hours for the entire period
- Time resolution toggles - Switch between Days, Weeks, Months, or Years views
The Days view is useful for identifying specific productive days. Weeks view helps you track consistency across weeks. Months is best for understanding seasonal trends (default). Years shows long-term patterns.
Employee Time Breakdown by Client
See how many hours you've logged for each client as a table with hours and a progress bar. This helps you understand which clients consume most of your time and can be useful for planning your schedule.
Employee Time Breakdown by Project
Detailed breakdown of hours per project in a table. If you work on multiple projects, this view helps you see project-level utilization with a progress bar for visual comparison.
Employee Time Entries by Age
Shows the age distribution of your time entries — how recently entries were logged. This helps you identify:
- Recently logged entries (freshly entered, e.g., "2 days later")
- Entries logged several days ago (e.g., "5 days later")
- Older entries (listed as "Later", may indicate backlog)
Employee Time by User Role
Shows hours split between Project owner and Not project owner. Useful for understanding how much of your time is spent managing projects versus executing work.
Employee Time Breakdown by Project Billing Setting
Displays hours organized by billing setting. Most projects are marked Billing enabled, showing which billing model consumes your time.
Employee Time Breakdown by Label
If your projects use labels (e.g., "Internal", "High Priority"), this section breaks down hours by label. Helpful for understanding time spent on different work types. Note that if a project has multiple labels, time is counted for each label.
Employee Time Breakdown by Project Owner
Shows hours distributed across different project owners. Useful for seeing which colleagues' projects you spend the most time on.
Selecting a Time Period
At the top of the page, click the year dropdown (displaying the current year, e.g., "2026") to choose a different year. The page displays data for the full calendar year (January through December).
Time Resolution Controls
Below the Employee Time Breakdown chart, toggle between different time granularities:
- Days - Most detailed view, shows daily patterns
- Weeks - Useful for identifying weekly trends
- Months - Standard view for monthly analysis (default)
- Years - Long-term perspective across multiple years
Choose the resolution that best matches your analysis needs. For example:
- Use Days when investigating a specific week's productivity
- Use Weeks to spot consistent patterns
- Use Months for performance reviews
- Use Years for multi-year trend analysis
Time resolution controls appear in two locations:
- Above the Time breakdown by project and period table
- Below the Employee time breakdown chart
Best Practices
Monitor Your Distribution Review how your time is distributed across clients and projects. Uneven distribution may indicate bottlenecks or opportunities for delegation.
Check Entry Age Regularly If you see old time entries in the "Time entries by age" section, log recent time promptly to keep your records current.
Use for Personal Goal Setting Compare your hours against your daily target (set in your profile) to see if you're meeting personal work hour goals.
Review Role Distribution If applicable, check the "Time by user role" breakdown to ensure you're spending appropriate time on different responsibilities.
Track Project vs. Client Focus Use the project and client breakdowns to understand whether you're becoming too specialized in one area or spreading yourself too thin.
Discuss with Management Share your performance metrics with your manager during reviews to illustrate your workload distribution and contribution.
Performance Insights
Identifying Utilization Issues If your hours are concentrated in a few projects, you may be at risk if those projects end. Aim for balanced allocation.
Understanding Billable Time Compare hours logged across different billing models. Are you spending disproportionate time on fixed-price projects?
Role Transition Analysis If your role distribution has changed significantly, use this to quantify the shift in your responsibilities.
Client Concentration If one client represents a large percentage of your hours, consider this when planning workload and resource allocation.