
What is Progress Analysis?
Progress analysis provides a detailed breakdown of time and progress for each activity in a project. It shows how many hours have been logged, how they've been adjusted, and how many are billable or billed, all organized by activity and time period.
Use progress analysis to:
- Track time against budget — See how logged hours compare to budgeted hours
- Monitor billable time — Understand how much time is billable vs. unbilled
- Spot over-budget activities — Identify activities using more time than allocated
- Analyze trends — Compare progress across months and activities
- Plan future work — Use past data to inform estimates for similar activities
Accessing Progress Analysis
- Navigate to a project in Projects.
- Click Progress analysis in the project overview section.
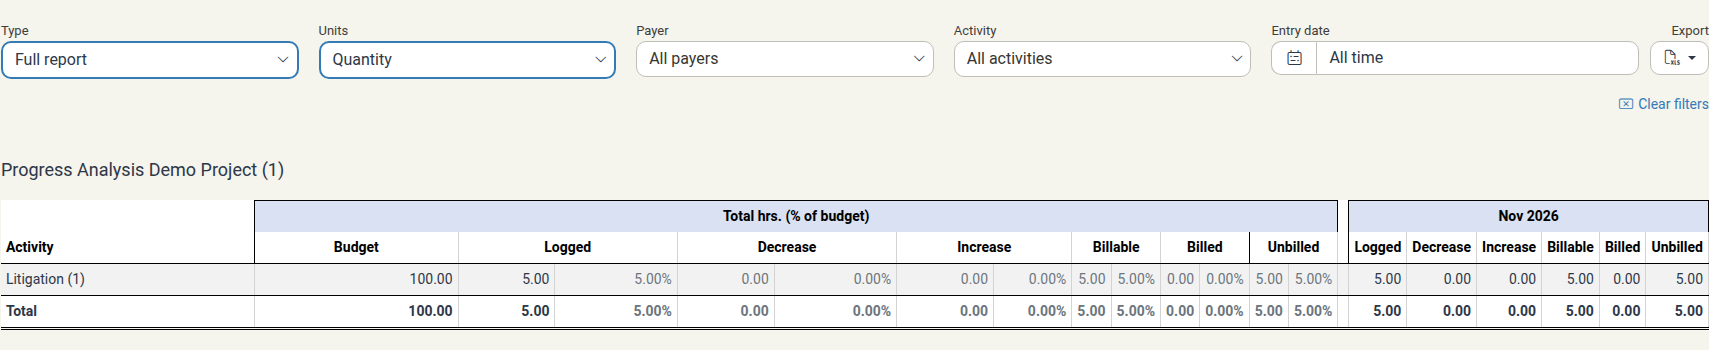
Using Filters
At the top of the progress analysis page, several filter options help you customize the view:
| Filter | What it does |
|---|---|
| Type | Choose Full report for the complete internal breakdown, or Report for client for a client-facing summary that shows only budget and billed figures |
| Units | Switch between Quantity (hours) and Amounts (currency) |
| Payer | Filter to a specific payer, or view All payers |
| Activity | Select one activity or view All activities |
| Entry date | Limit data to a specific date range, or use All time |
After adjusting filters, the table updates automatically. The columns shown change with the Type and Units you select — for example, Report for client hides the internal columns (Logged, Decrease, Increase, Billable, Unbilled) and shows only Budget and Billed. Use Clear filters to reset to the full view.
Understanding the Table
The progress analysis table shows detailed data for each activity. The columns vary by time period and include:
Budget Column
- Budget — The hours budgeted for this activity when it was created
Main Metrics
- Logged — Total hours logged to the activity
- Decrease — Hours reduced from the activity (e.g., write-offs or corrections)
- Increase — Hours added to the activity (e.g., revisions or additional work)
- Billable — Hours that can be billed to the client (logged + increases − decreases)
- Billed — Hours that have been invoiced
- Unbilled — Billable hours not yet invoiced
Time Periods
The table includes columns for:
- Total hrs. (% of budget) — All-time summary with percentage of budget used
- Nov 2026 — One grouped set of columns for each month that has entries, showing the detailed breakdown for that period
Each period shows the same columns (Logged, Decrease, Increase, Billable, Billed, Unbilled) so you can compare progress month by month.
Totals Row
At the bottom, the Total row sums all activities for each period, giving you an overall project view.
Interpreting the Data
Logged < Budget The activity is running under budget. You're using less time than allocated.
Logged > Budget The activity is over budget. You've spent more time than planned. Consider increasing the budget or investigating why.
Decrease > 0 Hours were removed from the activity. This might be a write-off or correction. Check why hours were reduced.
Billable < Logged Some logged hours are not billable (they've been decreased). This might be a write-off or unbillable time.
Unbilled > 0 There are billable hours not yet invoiced. Consider creating an invoice to claim these hours.
Billed == Billable (all periods) All billable time has been invoiced. The activity is fully billed.
Using the Export
Click the Export button and choose Download as Excel spreadsheet to download the progress analysis table for further analysis or sharing with managers and clients.
Best Practices
Check weekly Review progress analysis weekly to catch over-budget activities early.
Investigate increases and decreases If hours are frequently increased or decreased, investigate why. It may indicate poor initial estimates or scope creep.
Compare to profit analysis Use Progress analysis to see time spent, then use Profit analysis to see whether that time is profitable.
Monitor unbilled time High unbilled hours mean money waiting to be claimed. Create invoices promptly to improve cash flow.
Use for future estimates When planning similar activities, reference past progress data to inform your time estimates.
Watch percentage of budget If an activity is at 100% of budget or higher, flag it for review before logging additional time.