
The Write-off report shows hours that were logged on billable projects but never billed to the client. Written-off hours are working capacity that was spent without being converted into billable value — for example because work exceeded a fixed fee, because an activity is excluded from billing, or because a billable was written down before invoicing.
Accessing the Write-off Report
- Click Reports in the main navigation.
- Select Write-off from the Reports submenu, or click Write-off on the Reporting overview page.
- The report opens for the current calendar year. Use the period selector next to the page title to change the period.
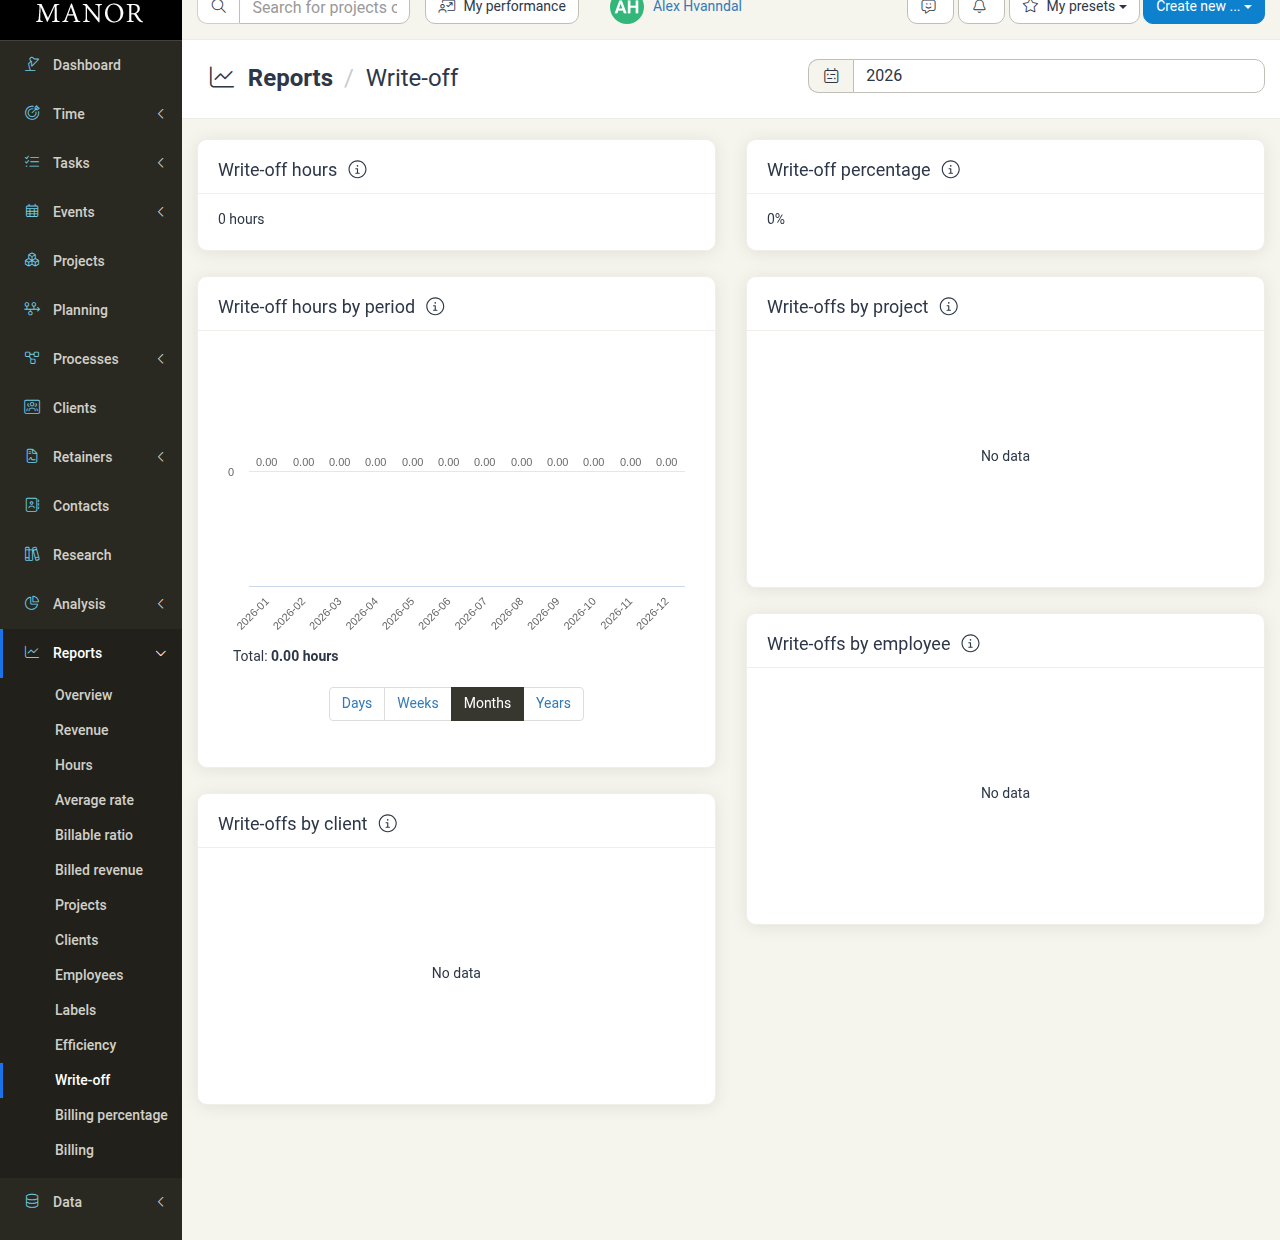
The Write-off report has no extra filter dropdowns — the period selector is the only control for narrowing the data. To look at write-offs for one client or project, read the corresponding breakdown table instead.
Key Metrics
Two cards at the top of the report summarise the selected period. Each card title has an info icon with the same explanation:
- Write-off hours — The difference between the sum of all logged hours and the sum of all billable hours, for work in projects with billing set to enabled and activities that are not excluded from billing.
- Write-off percentage — The same difference expressed as a percentage of the logged hours in those projects.
Calculation & Criteria
The headline write-off hours figure is calculated as:
Write-off hours = total logged hours − total billable hours
The result never drops below zero, and only these entries are counted:
- Work in projects where billing is set to Enabled.
- Activities that are not excluded from billing.
The breakdown cards are broader than the two headline cards: the chart and the tables include work in projects with any billing setting, so a project with billing disabled still appears there if its logged hours were not billed.
Period and Time Resolution
By default, the report covers the current calendar year (for example 01.01.2026 - 31.12.2026). The selected period is shown as a button with a calendar icon next to the Reports / Write-off title. It displays a short label — a year such as 2026, a month such as October, All time, or a date range such as 01.01.2024 - 31.12.2026 when a custom range is applied.
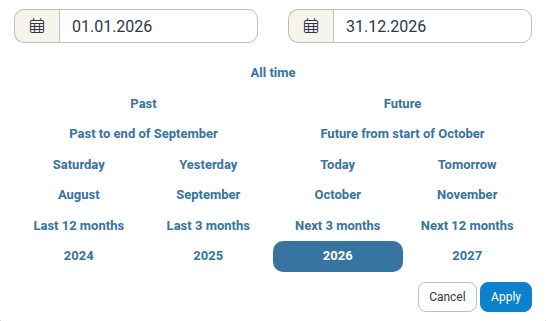
Click the button to open the period picker:
- Quick presets — All time, Past, Future, plus relative presets such as Today, Yesterday, Tomorrow, the current and neighbouring months, Last 3 months, Last 12 months, Next 3 months, Next 12 months, and the previous, current, and next years (for example 2024–2027).
- Custom range — Type a start and end date in the two date fields, then click Apply. Click Cancel to close the picker without changing the period.
Below the Write-off hours by period chart, use the Days, Weeks, Months, and Years links to change how the chart groups the data. Months is selected by default. Each bar covers one increment and its value is printed above the bar, and the total for the whole period is shown as Total: under the chart.
Report Breakdowns
The report organises write-offs into four breakdowns.
1. Write-off hours by period
A chart showing write-off hours over time, with a bar for each day, week, month, or year in the selected period depending on the time resolution. A Total: line under the chart shows the write-off hours for the whole period. Use this card to see when write-offs happen — for instance a spike in a month where a project ran over budget.
2. Write-offs by client
Ranks clients by write-off hours. Use it to spot clients whose work is regularly written off, and to review whether the agreement, retainer, or scope needs revisiting.
3. Write-offs by project
Breaks write-off hours down by individual project. Use it to find projects with a lot of unbillable time — for example fixed-fee or capped projects that ran past their estimate — and to improve estimates for similar work.
4. Write-offs by employee
Breaks write-off hours down by team member. Use it to understand who spends time on work that cannot be billed, and to rebalance workload or provide training where needed.
When there is nothing to show for the selected period, the breakdown cards display No data.
Interpreting Write-off Data
- A low write-off percentage means most logged effort was billed, and scope control is working.
- A rising write-off percentage is worth investigating: compare the same client, project, or employee across periods to see whether the increase comes from a few projects or is spread out.
- A high write-off percentage usually points to a systematic cause. Common ones are work that exceeds a project budget without a change order, activities that should be excluded from billing being logged as billable activities, rework, or rates and fixed fees that no longer match the effort involved.
- Compare the figure with the Hours and Billable ratio reports for the same period to see whether more time was logged, less was billed, or both.
Best Practices
- Review the report before closing a period. Check write-offs while the work is still fresh, so you know which hours were written down deliberately and which were not billed by mistake.
- Inspect by project before invoicing. Compare each project's write-off hours with its budget to decide whether the hours should be billed, written off, or covered by a change order.
- Keep activity settings accurate. If work is meant to be unbilled internal time, log it on an activity that is excluded from billing so it does not appear as a write-off on a billable project.
- Set the period first. Use the period selector to pick a year or range before you read the numbers, so you always know what the report covers.
Related Documentation
- Reporting — Overview of Manor's reporting suite and how to set periods and filters
- Billable ratio — What percentage of logged hours is billable
- Hours — All logged hours broken down by project, client, employee, rate, and label
- Revenue — Revenue generated from billable work
- Average rate — The average effective hourly rate