
The Billing report shows your billed revenue across different time periods and dimensions. It helps you track billing progress and understand revenue generation by project, client, and employee.
Report Overview
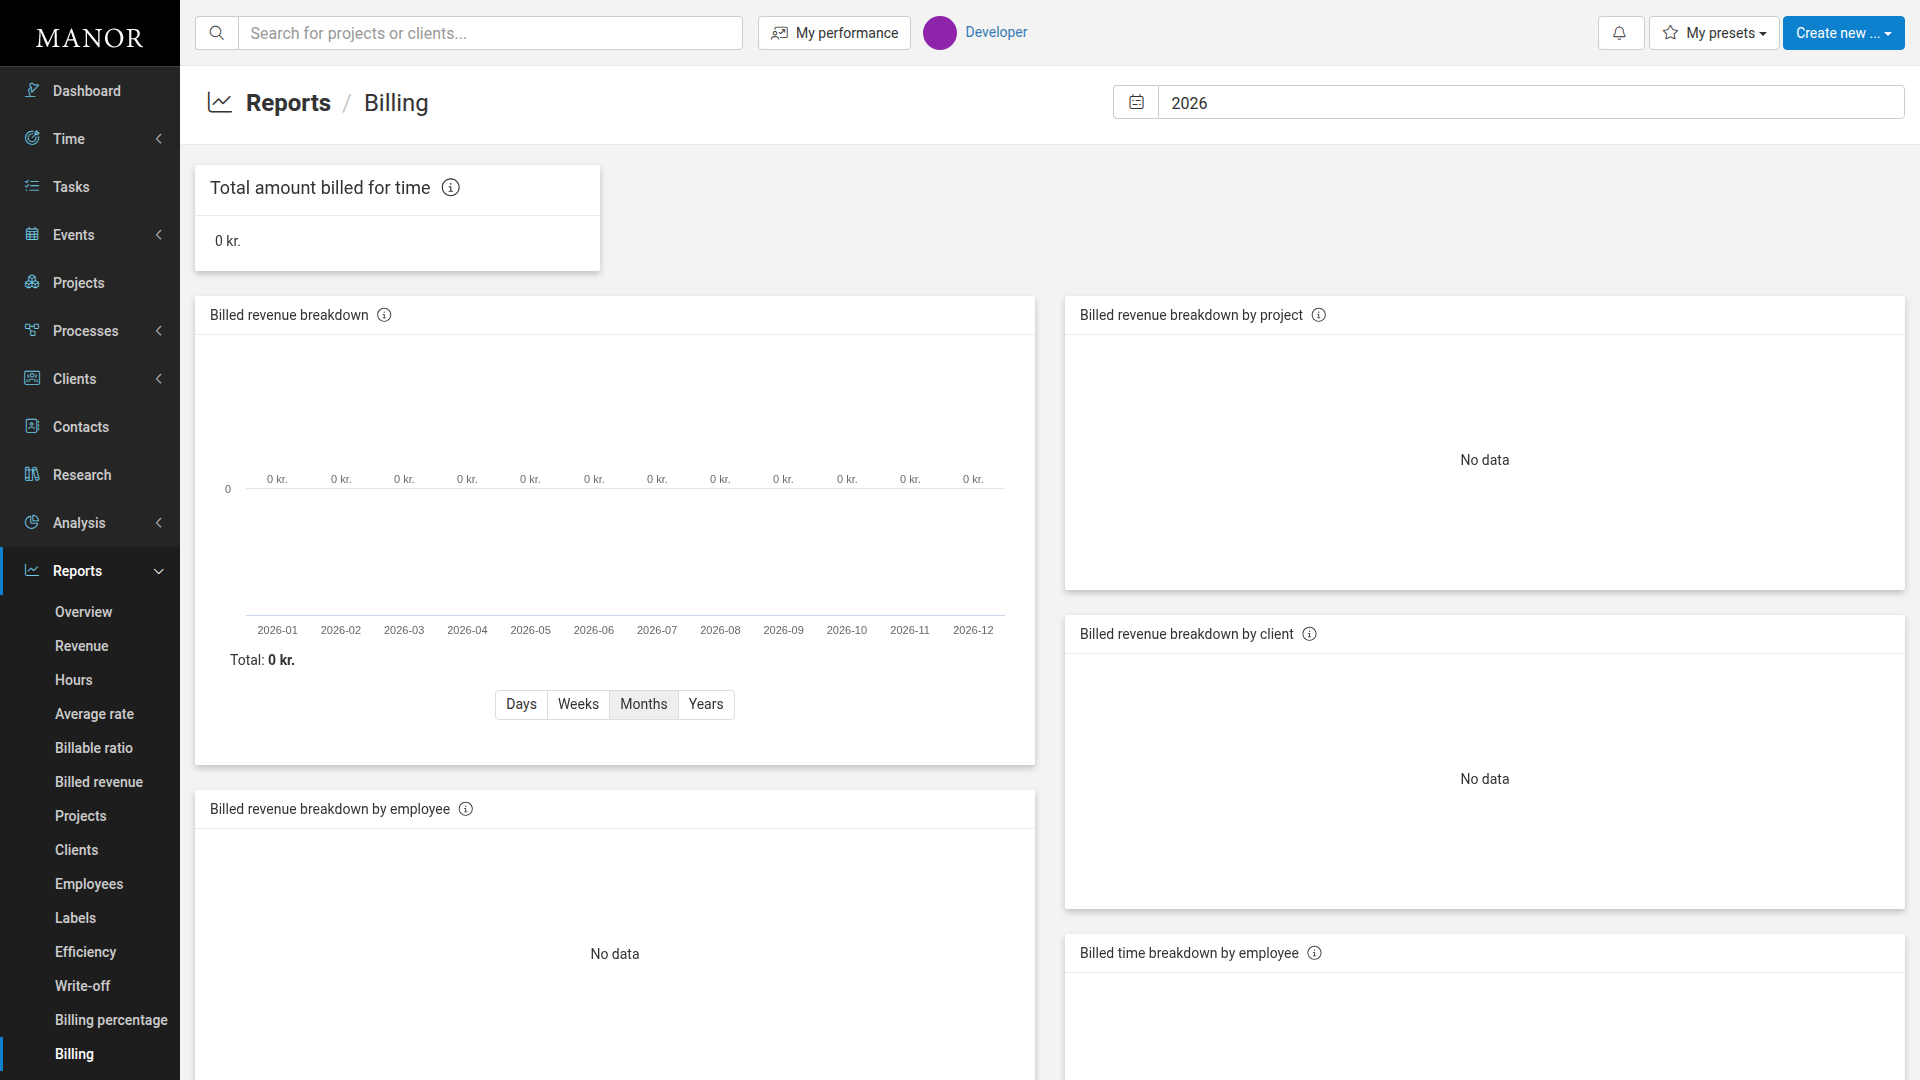
The Billing report displays:
- Total amount billed for time — Total revenue from invoiced work
- Billed revenue breakdown — Revenue by time period (day, week, month, or year)
- Billed revenue breakdown by project — Revenue by individual project
- Billed revenue breakdown by client — Revenue by individual client
- Billed revenue breakdown by employee — Revenue by team member
- Billed time breakdown by employee — Hours of billable time by team member
Using the Billing Report
To access the report:
-
Navigate to Reports in the main menu.
-
Click the Billing link.
The report loads with the current year selected by default. You can change the year using the date selector in the top right.
Understanding the Report
Total Amount Billed for Time
Shows the total revenue from invoiced work during the selected period.
Billed Revenue Breakdown
A chart showing revenue across months within the selected year. You can change the time resolution to view:
- Days — Daily breakdown
- Weeks — Weekly breakdown
- Months — Monthly breakdown
- Years — Yearly breakdown
Breakdowns by Project, Client, and Employee
The report shows how billed revenue and time are distributed across different dimensions, helping you identify:
- Top-performing projects
- Most valuable clients
- Team members' contribution to billed revenue
Related Reports
- Billed revenue — Detailed revenue from invoiced work
- Revenue — Total revenue generated
- Billing percentage — Percentage of billable hours billed by project
- Hours — Total hours logged