
What is the Employees Report?
The Employees Report shows how much time each employee has logged in your firm. It breaks down employee time contributions by total hours, billable hours, revenue generated, logging efficiency, and project ownership. This report helps you understand employee productivity and workload distribution.
Why the Employees Report Matters
Using the Employees Report helps you:
- Track employee productivity - See how many hours each employee is logging
- Identify billable work - Understand what percentage of each employee's time is billable
- Monitor revenue contribution - See which employees are generating the most revenue
- Evaluate efficiency - Check same-day logging rates to identify time tracking habits
- Analyze project ownership - See which employees are managing the most projects
Accessing the Employees Report
To access the Employees Report:
-
Navigate to Reports from the main menu.
-
Click Employees.
-
The report displays multiple data breakdowns. You can filter by year using the year selector in the top-right corner.
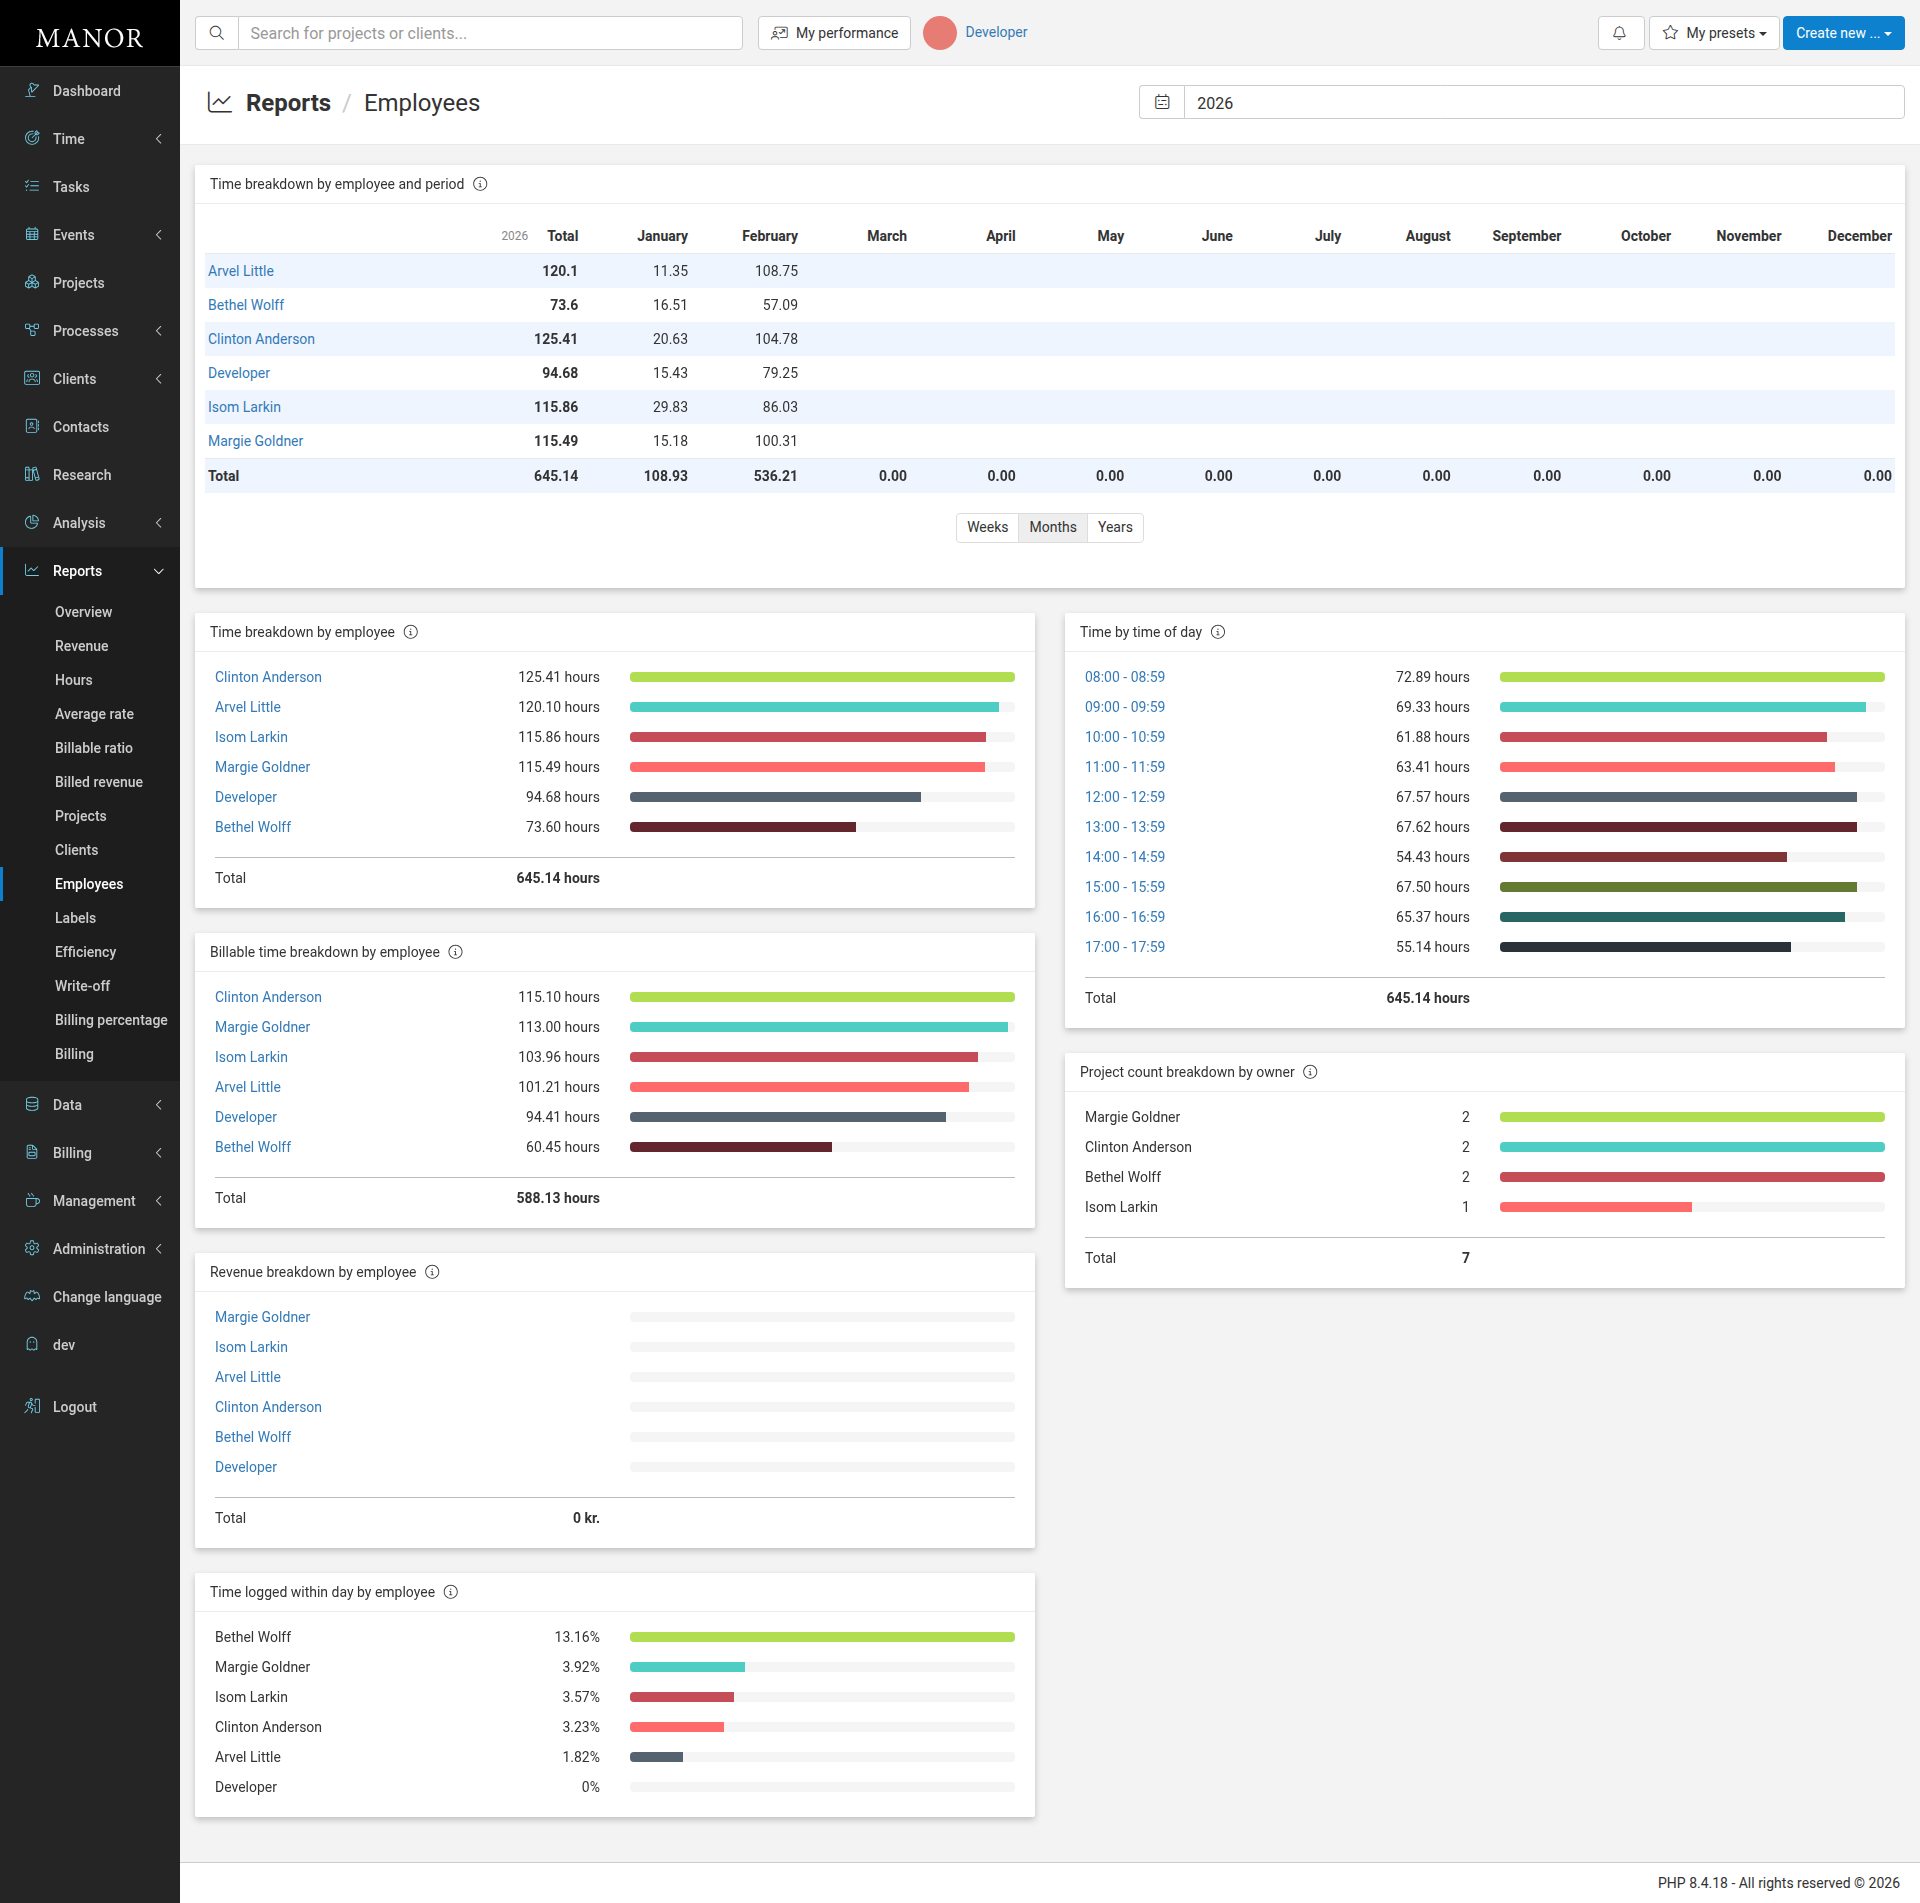
Understanding the Report Sections
Time Breakdown by Employee and Period
This table shows each employee's total hours logged, broken down by month.
Key Information:
- Employee Names - Listed in rows
- Total - Total hours logged for the entire year
- Monthly Columns - Hours logged per month (January through December)
- Resolution Options - Switch between viewing by Weeks, Months, or Years
The table also shows a Total row at the bottom with the combined hours across all employees.
Time Breakdown by Employee
This bar chart shows each employee's total hours logged with a horizontal bar representation.
Key Information:
- Employee name - Listed with their total hours
- Progress bar - Visual representation of hours relative to others
- Total hours - Numeric value showing total hours logged
Click on any employee name to drill down into the Hours report filtered by that employee.
Billable Time Breakdown by Employee
This bar chart shows billable hours only (time billed to clients) for each employee.
Key Information:
- Employee name - Employees listed by billable hours
- Billable hours - Only time marked as billable to a client
- Progress bar - Visual comparison of billable hours
This helps identify which employees spend the most time on billable work versus internal/non-billable tasks.
Revenue Breakdown by Employee
This section shows the revenue generated by each employee's billable work.
Key Information:
- Employee name - Listed with their generated revenue
- Revenue amount - Total revenue from that employee's billable hours
- Progress bar - Visual comparison of revenue contribution
Click on an employee name to drill down into the Revenue report filtered by that employee.
Time Logged Within Day by Employee
This metric shows the percentage of each employee's time entries logged the same day the work was performed.
Key Information:
- Same-day percentage - Shows what % of time entries were logged same-day (ideal is 100%)
- Employee name - Each employee's same-day logging score
High percentages indicate disciplined time tracking behavior. Low percentages may suggest time entries are logged days or weeks later.
Time by Time of Day
This table shows when employees typically log hours, broken down by hour of the day.
Key Information:
- Time range - Hour of day (08:00-09:00, 09:00-10:00, etc.)
- Hours logged - Total hours logged during that hour across all employees
- Progress bar - Visual distribution of logging throughout the day
This helps understand your firm's work patterns and peak productivity hours.
Click on any time range to drill down into the Hours report filtered by that time of day.
Project Count Breakdown by Owner
This table shows how many projects each employee is managing or owns.
Key Information:
- Employee name - Project owner names
- Project count - Number of active projects owned by that employee
- Progress bar - Visual comparison of project ownership
This helps balance project loads across your team.
Filtering the Report
You can filter the Employees Report by year using the year selector in the top-right corner of the report. This allows you to compare employee performance across different years.
Using the Report for Decision-Making
Workload Distribution: Review the "Time Breakdown by Employee" section to ensure workload is evenly distributed. If some employees consistently log more hours, consider rebalancing assignments.
Billable vs. Non-Billable: Use the "Billable Time Breakdown" section to ensure your team is spending sufficient time on billable work. This affects firm profitability.
Efficiency Assessment: Check the "Time Logged Within Day" metric to evaluate time tracking discipline. Employees logging time same-day provide more accurate data for billing and analysis.
Revenue Contribution: Use the "Revenue Breakdown" to understand which employees contribute most to firm revenue. This can inform performance reviews and compensation decisions.
Project Ownership: Review "Project Count Breakdown by Owner" to ensure no single employee is overloaded with too many projects.
Drilling Down for More Details
Most sections in the Employees Report are clickable links that take you to more detailed reports:
- Click an employee name to see their full Hours or Revenue report
- Click a time range to see hours logged during that time of day
- Use the resolution options (Weeks, Months, Years) to change the time granularity
Exporting the Report
You can export employee data from this report by clicking the Export button at the top of the page. This downloads the data in Excel format for further analysis in spreadsheets or other tools.
Common Use Cases
Monthly Performance Reviews: Review the "Time Breakdown by Employee and Period" section to see each employee's monthly hour patterns for performance discussions.
Identifying Training Needs: Low "Time Logged Within Day" percentages suggest an employee might benefit from time tracking training or reminders.
Workload Planning: Use "Project Count Breakdown" and "Time Breakdown" sections together to plan workload for upcoming periods.
Profitability Analysis: Compare "Billable Time" against "Total Time" to calculate billable utilization rates for each employee.
Tips and Best Practices
- Review monthly - Check this report monthly to identify trends in employee productivity
- Combine with other reports - Use this report alongside the Revenue and Hours reports for complete analysis
- Watch same-day logging - Employees with low same-day percentages may be providing less accurate time data
- Balance project ownership - Ensure no employee is assigned too many projects
- Track seasonal patterns - Use the monthly breakdown to identify busy seasons and plan accordingly