
Overview
The Labels report shows you how hours and revenue are distributed across the labels assigned to your projects. Use this report to understand which label categories are most important to your business, where the most hours are being logged, and how revenue compares across labels.
Key Metrics
- Project count by label — How many projects have each label
- Time by label — Total hours logged across projects with each label
- Billable time by label — Hours that are marked as billable by label
- Revenue by label — Total revenue generated by projects with each label
- Average price by label — Average hourly rate across projects with each label
- Projects with labels — Count of projects that have any label assigned
Viewing the Labels Report
- Navigate to Reports in the main menu.
- Click Labels to view the report.
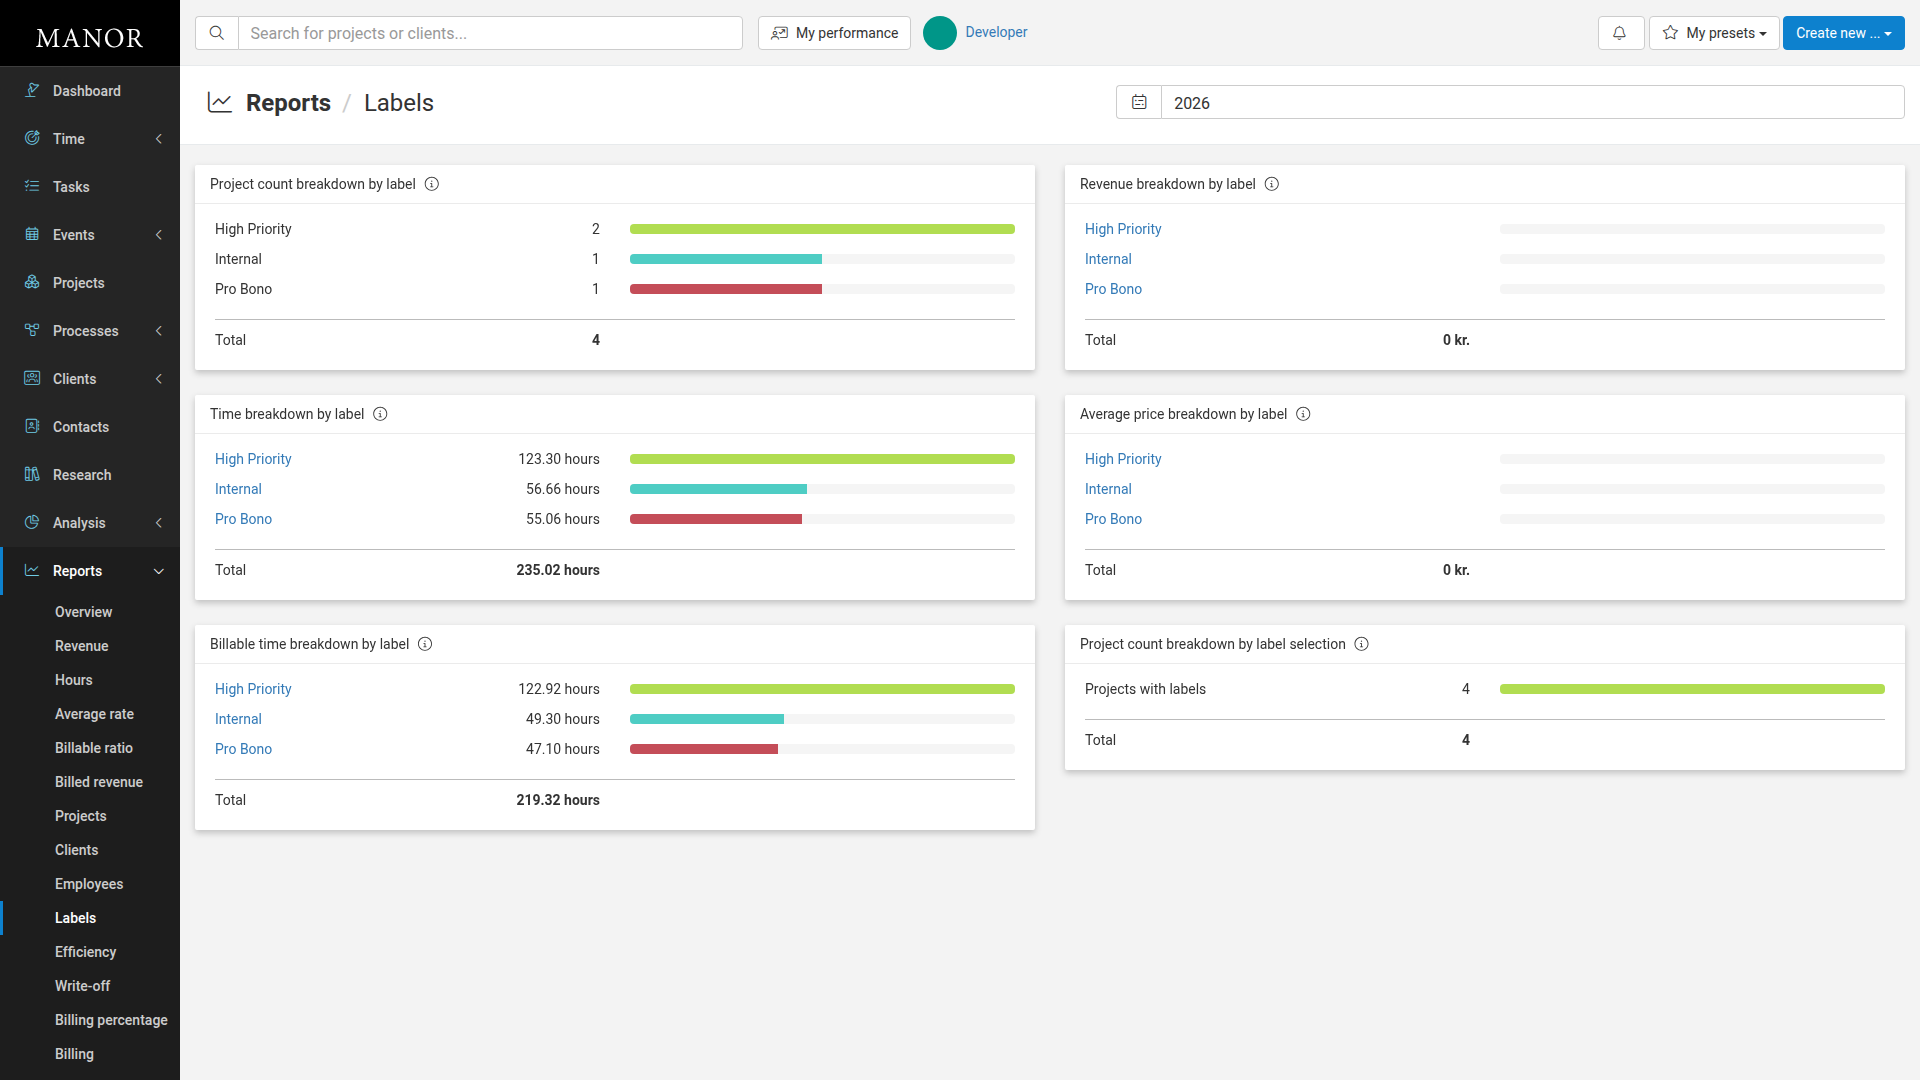
Understanding the Data
The report displays the following sections:
Project Count Breakdown by Label — Shows how many projects are assigned each label. This helps you see which label categories are most used in your organization.
Time Breakdown by Label — Displays total hours logged across projects with each label. Label names are clickable links that filter the Hours report by that label.
Billable Time Breakdown by Label — Shows billable hours by label. Compare this with total time to understand the billable percentage for each label.
Revenue Breakdown by Label — Displays total revenue generated by projects with each label. Click on a label name to filter the Revenue report.
Average Price Breakdown by Label — Shows the average hourly rate across projects with each label. Click on a label to view detailed rate information in the Average rate report.
Project Count Breakdown by Label Selection — Shows how many projects have labels assigned. This displays your label coverage across all projects.