
What is Analysis?
Analysis gives you a real-time view of your firm's revenue and billable hours broken down any way you need — by employee, client, project, department, or billable type. Where Reports give you fixed snapshots, Analysis lets you slice and filter live data with a chart and breakdown tables on the same screen.
Use Analysis to spot which clients or projects are driving revenue, track how hours are being used, and make faster decisions on pricing and resources.
Accessing Analysis
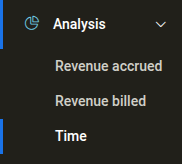
Click Analysis in the main navigation. The sidebar expands to show three views:
- Revenue accrued — revenue earned from logged billables, whether invoiced or not
- Revenue billed — revenue that has been invoiced to clients
- Time — hours logged rather than money, with tabs for hours worked, billable hours, billable ratio, average price, and same-day rate
Choosing a period
At the top of each Analysis view, the current period is shown — by default the current calendar year. Click it to select a different period. The period dropdown offers All time, specific years, and relative ranges such as Last 3 months and Next 12 months. The page also shows when the analysis data was last updated, on a line labelled Analysis last updated.
Revenue Accrued
Revenue accrued shows the total value of billable work logged in a period, regardless of whether it has been invoiced. This is your earned revenue — useful for understanding what you have generated before billing.
Billable type tabs
At the top of the page, switch between breakdowns by billable type:
- Total — all billable types combined
- Time — time entries only
- Travels — travel billables only
- Products — product billables only
- Expenses — expense billables only
- Per diems — per diem billables only
Filters
Use the filter dropdowns to narrow the data:
| Filter | What it does |
|---|---|
| User | Show revenue from a specific employee |
| Owner | Filter by project owner |
| Client | Limit to one or more clients |
| Project | Limit to one or more projects |
| Currency | Filter by billing currency |
| Billed status | Show only billed, only unbilled, or both |
| Firm and department | Filter to a specific department |
Chart
The central chart shows total revenue over the selected period. Use the Days / Weeks / Months / Years links below the chart to change the time resolution.
Breakdown tables
Below the chart, revenue is broken down by:
- Employee — who generated the revenue
- Client — which clients the revenue came from
- Project — which projects contributed
- Currency — revenue split by currency
- Billed — how much is invoiced vs. outstanding
- Department — revenue by department
- Project owner — who owns the projects generating revenue
- Billable type — split by time, travel, product, expense, or per diem
Revenue Billed
Revenue billed shows revenue that has been invoiced. Use this view to track what has actually gone out to clients in bills, and compare it against accrued revenue to see your outstanding billing pipeline.
This view has its own filter set: User, Client, Billable type, Owner, and Debit or credit. Its breakdown tables are Employee, Client, Billable type (with all retainer revenue grouped as retainer), Project owner, and Debit or credit. Switch between this view and Revenue accrued to see the gap between earned and invoiced revenue.
Time
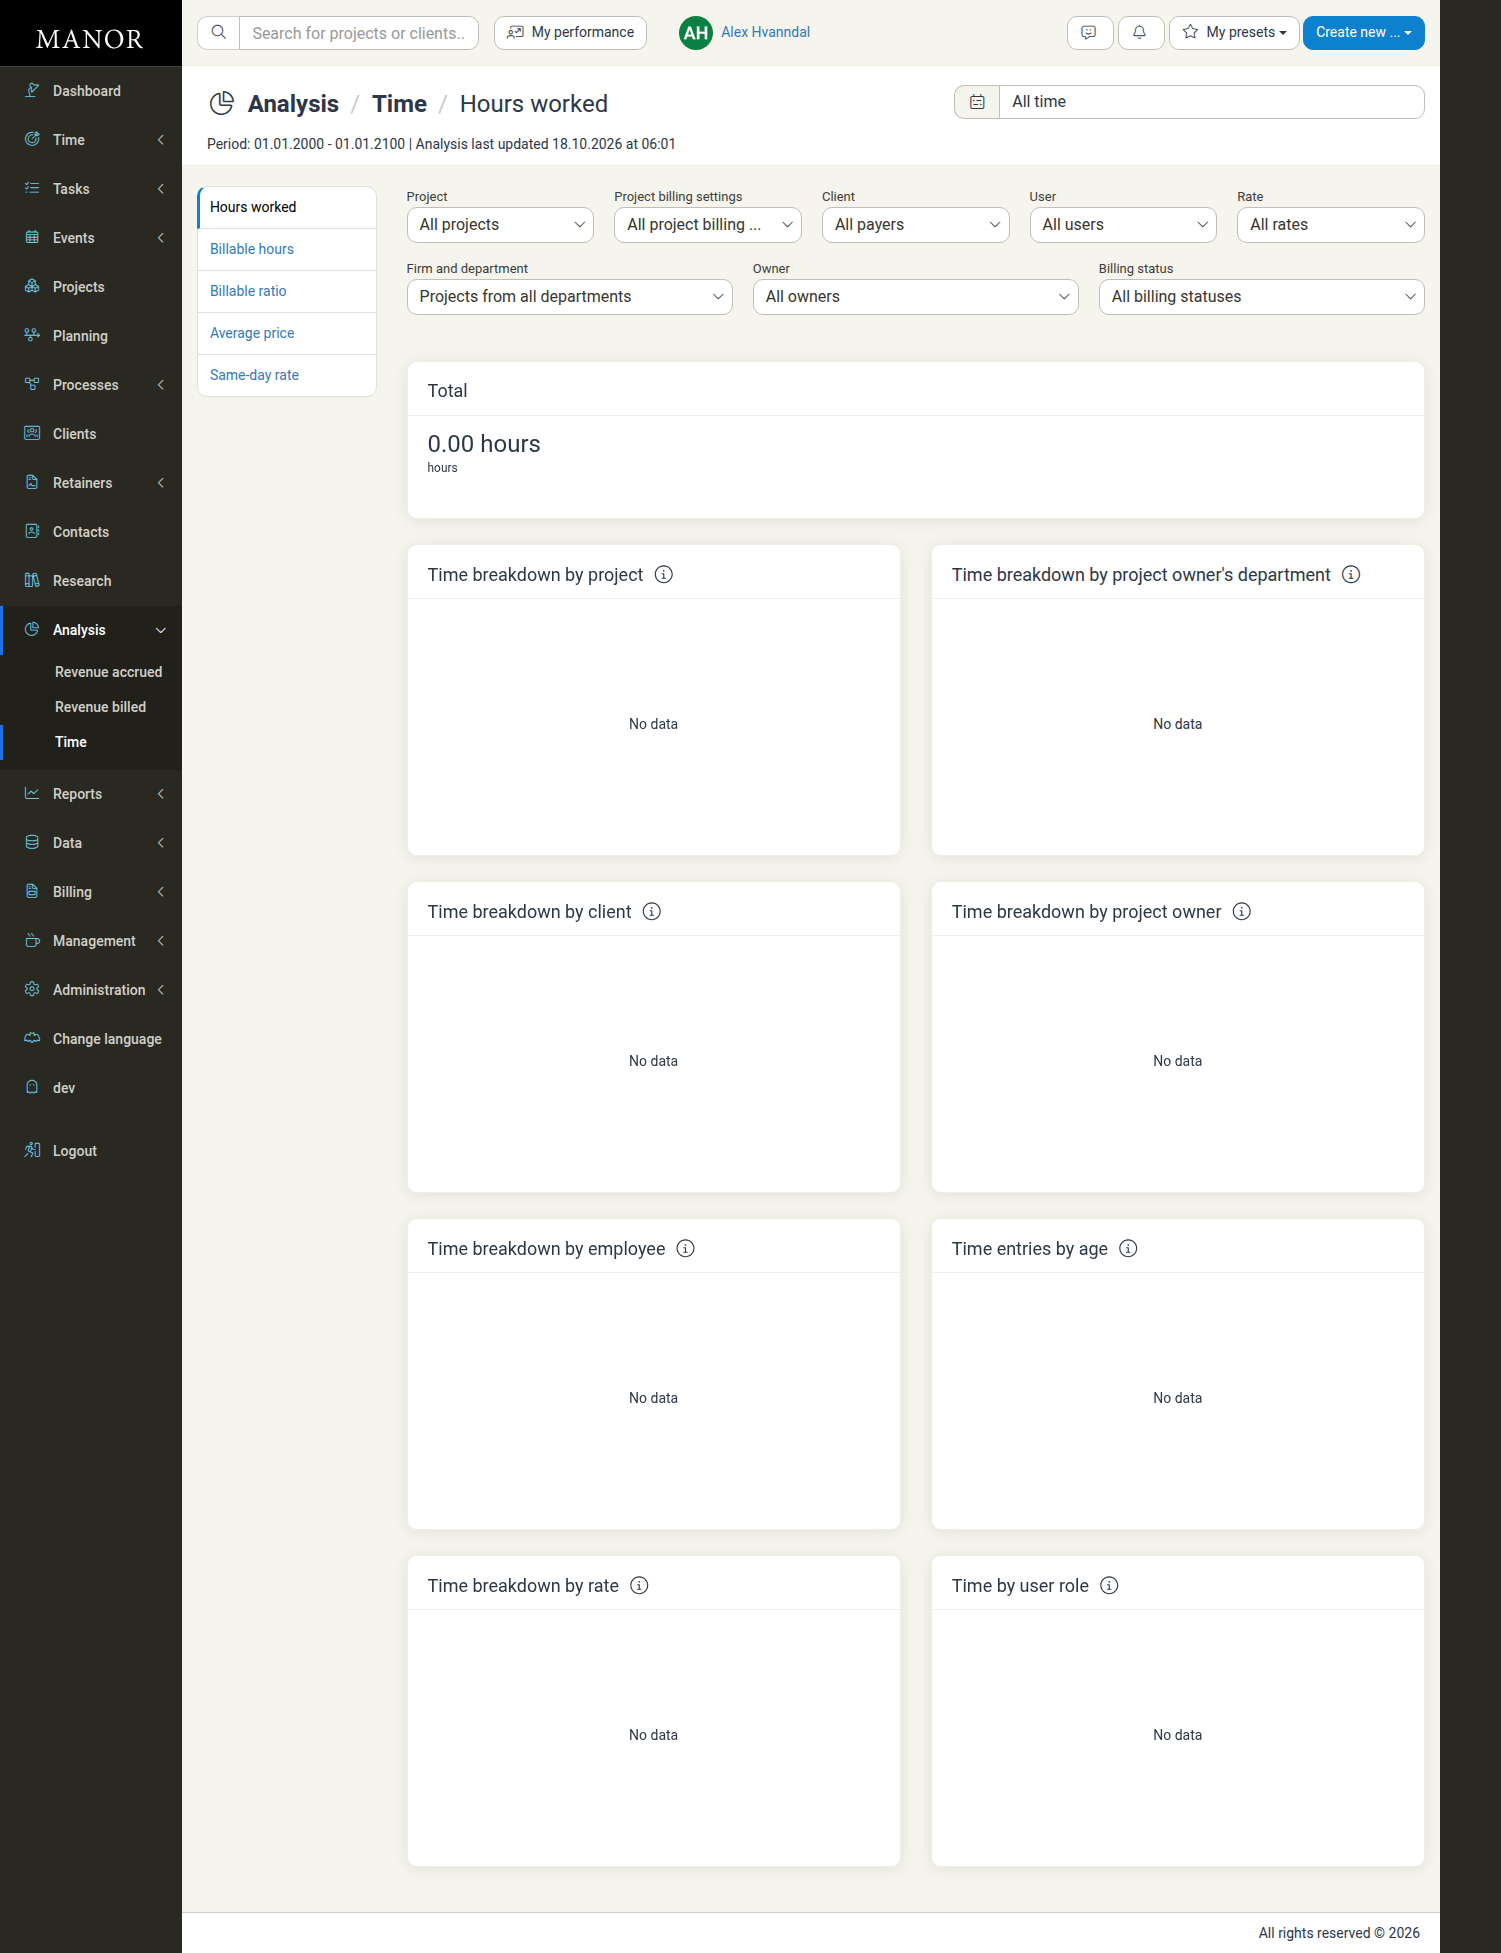
Time shows hours logged — not revenue. Use it to track how time is being spent across the firm, with a tab for each time metric.
Time tabs
At the top of the view, switch between time metrics. Hours worked is selected by default.
- Hours worked — total hours logged
- Billable hours — hours logged to billable work
- Billable ratio — the share of logged hours that is billable, as a percentage
- Average price — the average price per logged hour
- Same-day rate — the share of time entries that were registered on the same day as the work
Filters
| Filter | What it does |
|---|---|
| Project | Show time for a specific project |
| Project billing settings | Filter by how the project is billed |
| Client | Show time logged to a specific payer |
| User | Show time logged by a specific employee |
| Rate | Filter by billing rate |
| Firm and department | Filter to a specific department |
| Owner | Filter by project owner |
| Billing status | Show all, billed, or unbilled time |
Chart
The chart shows the total for the selected tab over the selected period. Switch between Days, Weeks, Months, and Years to change the time resolution.
Breakdown tables
On the Hours worked tab, hours are broken down by:
- Time breakdown by project — which projects consumed the most hours
- Time breakdown by client — hours per payer
- Time breakdown by employee — individual employee hour totals
- Time breakdown by rate — hours split by billing rate
- Time breakdown by project owner's department — hours by department
- Time breakdown by project owner — hours grouped by who owns the project
- Time entries by age — the percentage distribution of how many days have passed since each time entry was created, useful for spotting entries written up long after the work was done
- Time by user role — hours split by user role (e.g., partner, associate)
The breakdown tables adapt to the selected tab. The Billable hours tab shows the same tables with Billable time … headings, Billable ratio and Same-day rate show percentage breakdowns by project, client, employee, rate, department, and project owner, and Average price shows the revenue breakdown tables.
When there is no data for the selected period, the breakdown tables show No data.
Best Practices
Compare Revenue accrued vs. Revenue billed The gap between these two views shows unbilled work. If accrued revenue is consistently higher than billed, your billing cycle may be slow — follow up with invoice proposals to close the gap.
Use Time to spot over- and under-utilization Filter Time by employee to see who is logging the most hours. Combine with the Rate filter to understand where high-value time is going, and check the Same-day rate tab to see how promptly time is being logged.
Change the time resolution Monthly view is good for trend analysis. Switch to Weeks or Days when investigating a specific anomaly or period.
Filter before you share Apply client or project filters before sharing a screenshot with a manager — it keeps the data relevant and avoids confusion.
Check when data was last updated The timestamp below the period selector shows when the analysis was last recalculated. If you recently logged time and don't see it, the analysis may refresh on a schedule.