
What is Reporting?
The Reports section gives you fixed, ready-made views of your firm's numbers — revenue, logged hours, average rates, billing progress, and more. Each report combines one headline figure and a chart over time with a set of breakdown tables, so you can see both the total and where it comes from.
Reporting sits alongside the Analysis feature. Analysis lets you slice live data freely; Reports give you a set of prepared views, each focused on one question.
Available Reports
Open Reports in the main navigation and choose a report from the Overview page, or pick it directly from the Reports submenu.
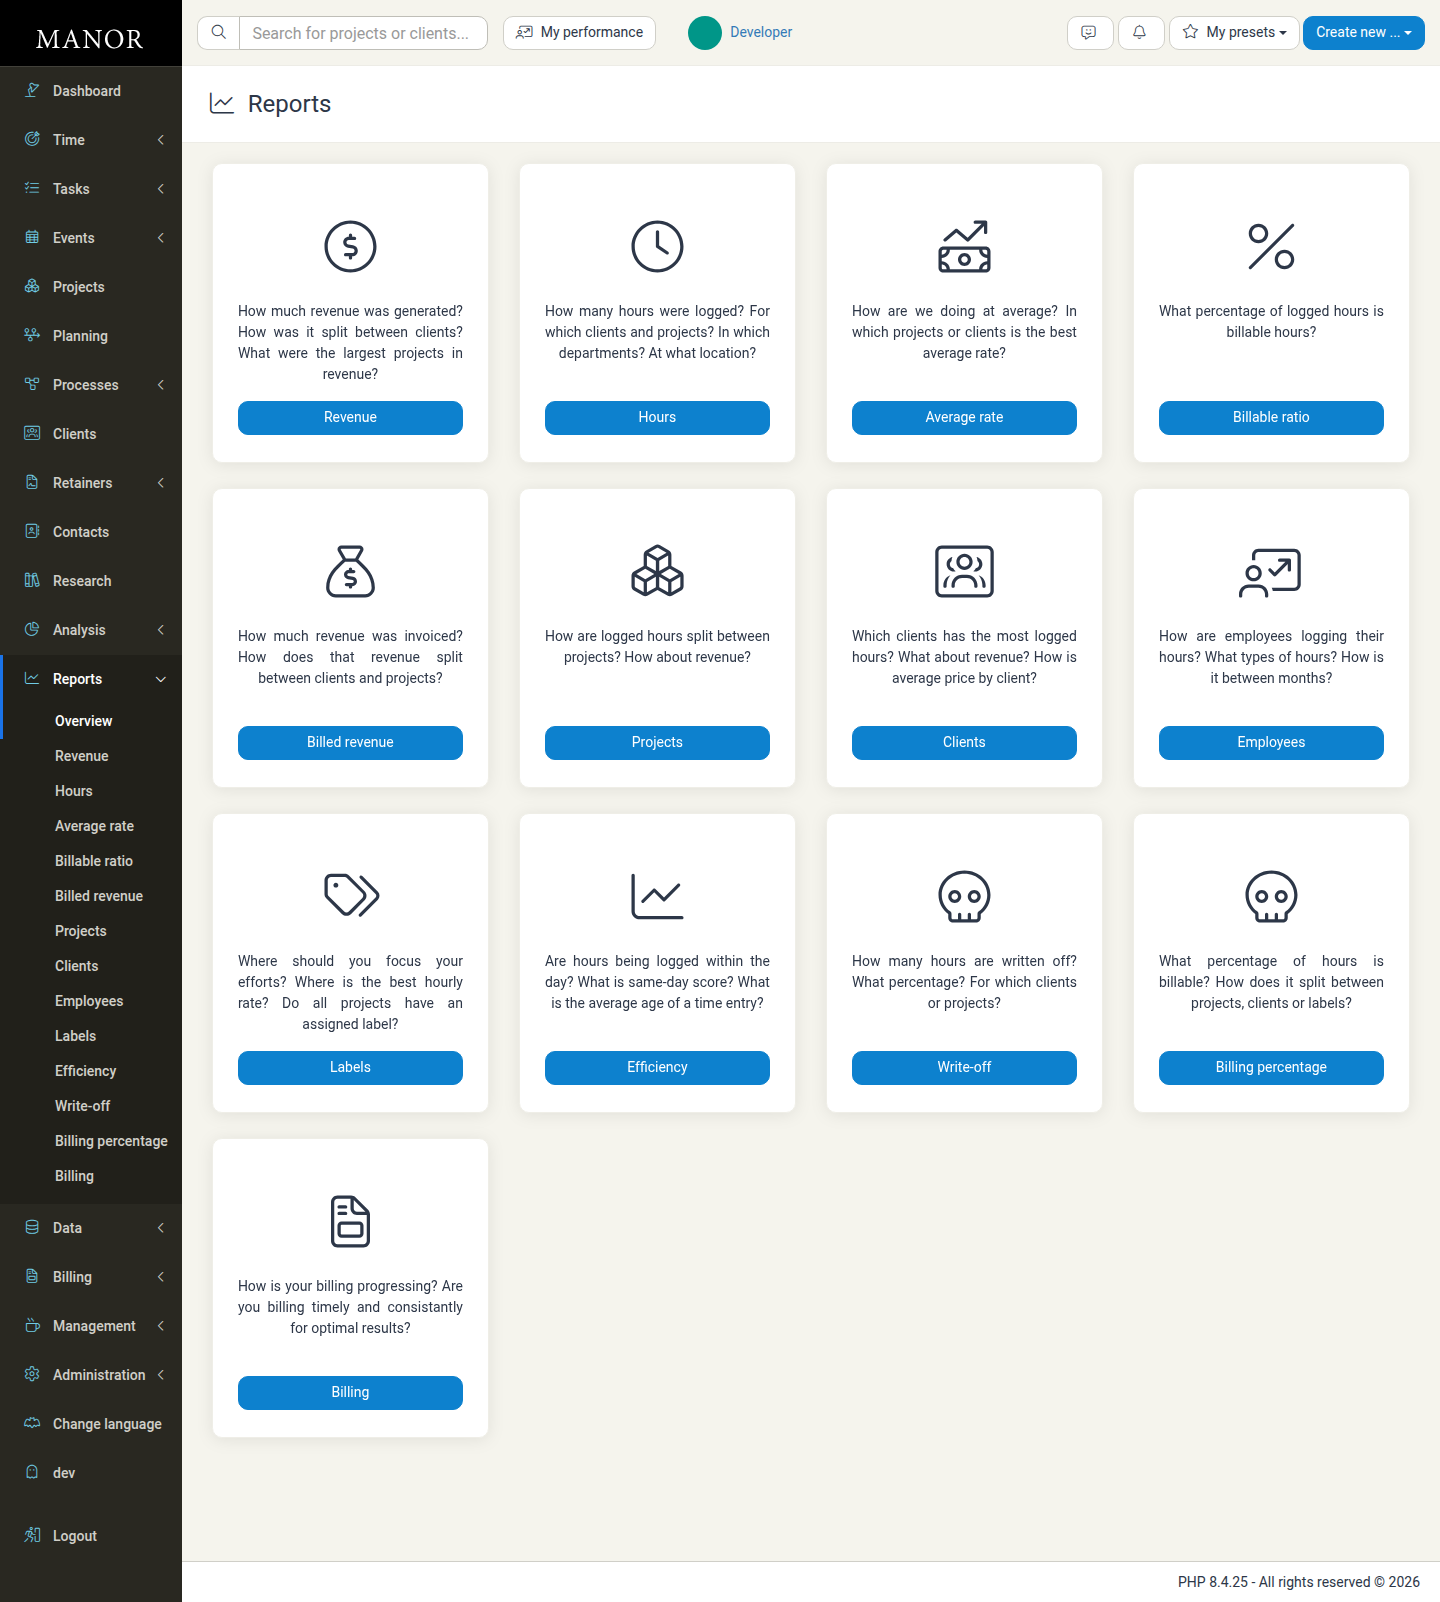
| Report | What it answers |
|---|---|
| Revenue | How much revenue was generated, and how it splits between clients and projects |
| Hours | How many hours were logged, and for which clients, projects, and departments |
| Average rate | How the firm is doing on average rate, and where the best rate is |
| Billable ratio | What percentage of logged hours is billable |
| Billed revenue | How much revenue was invoiced, and how it splits between clients and projects |
| Projects | How hours and revenue split between projects |
| Clients | Which clients have the most hours and revenue, and the average price by client |
| Employees | How employees log their hours, and how that varies between months |
| Labels | Hours and revenue by project label, and whether projects have a label |
| Efficiency | Whether hours are logged within the day, the same-day score, and the average age of a time entry |
| Write-off | How many hours are written off, and for which clients or projects |
| Billing percentage | What percentage of hours is billable, split between projects, clients, and labels |
| Billing | How billing is progressing, and whether you are billing timely and consistently |
Running a Report
- Click Reports in the main navigation.
- Select a report from the Overview page or the Reports submenu. For example, open Revenue.
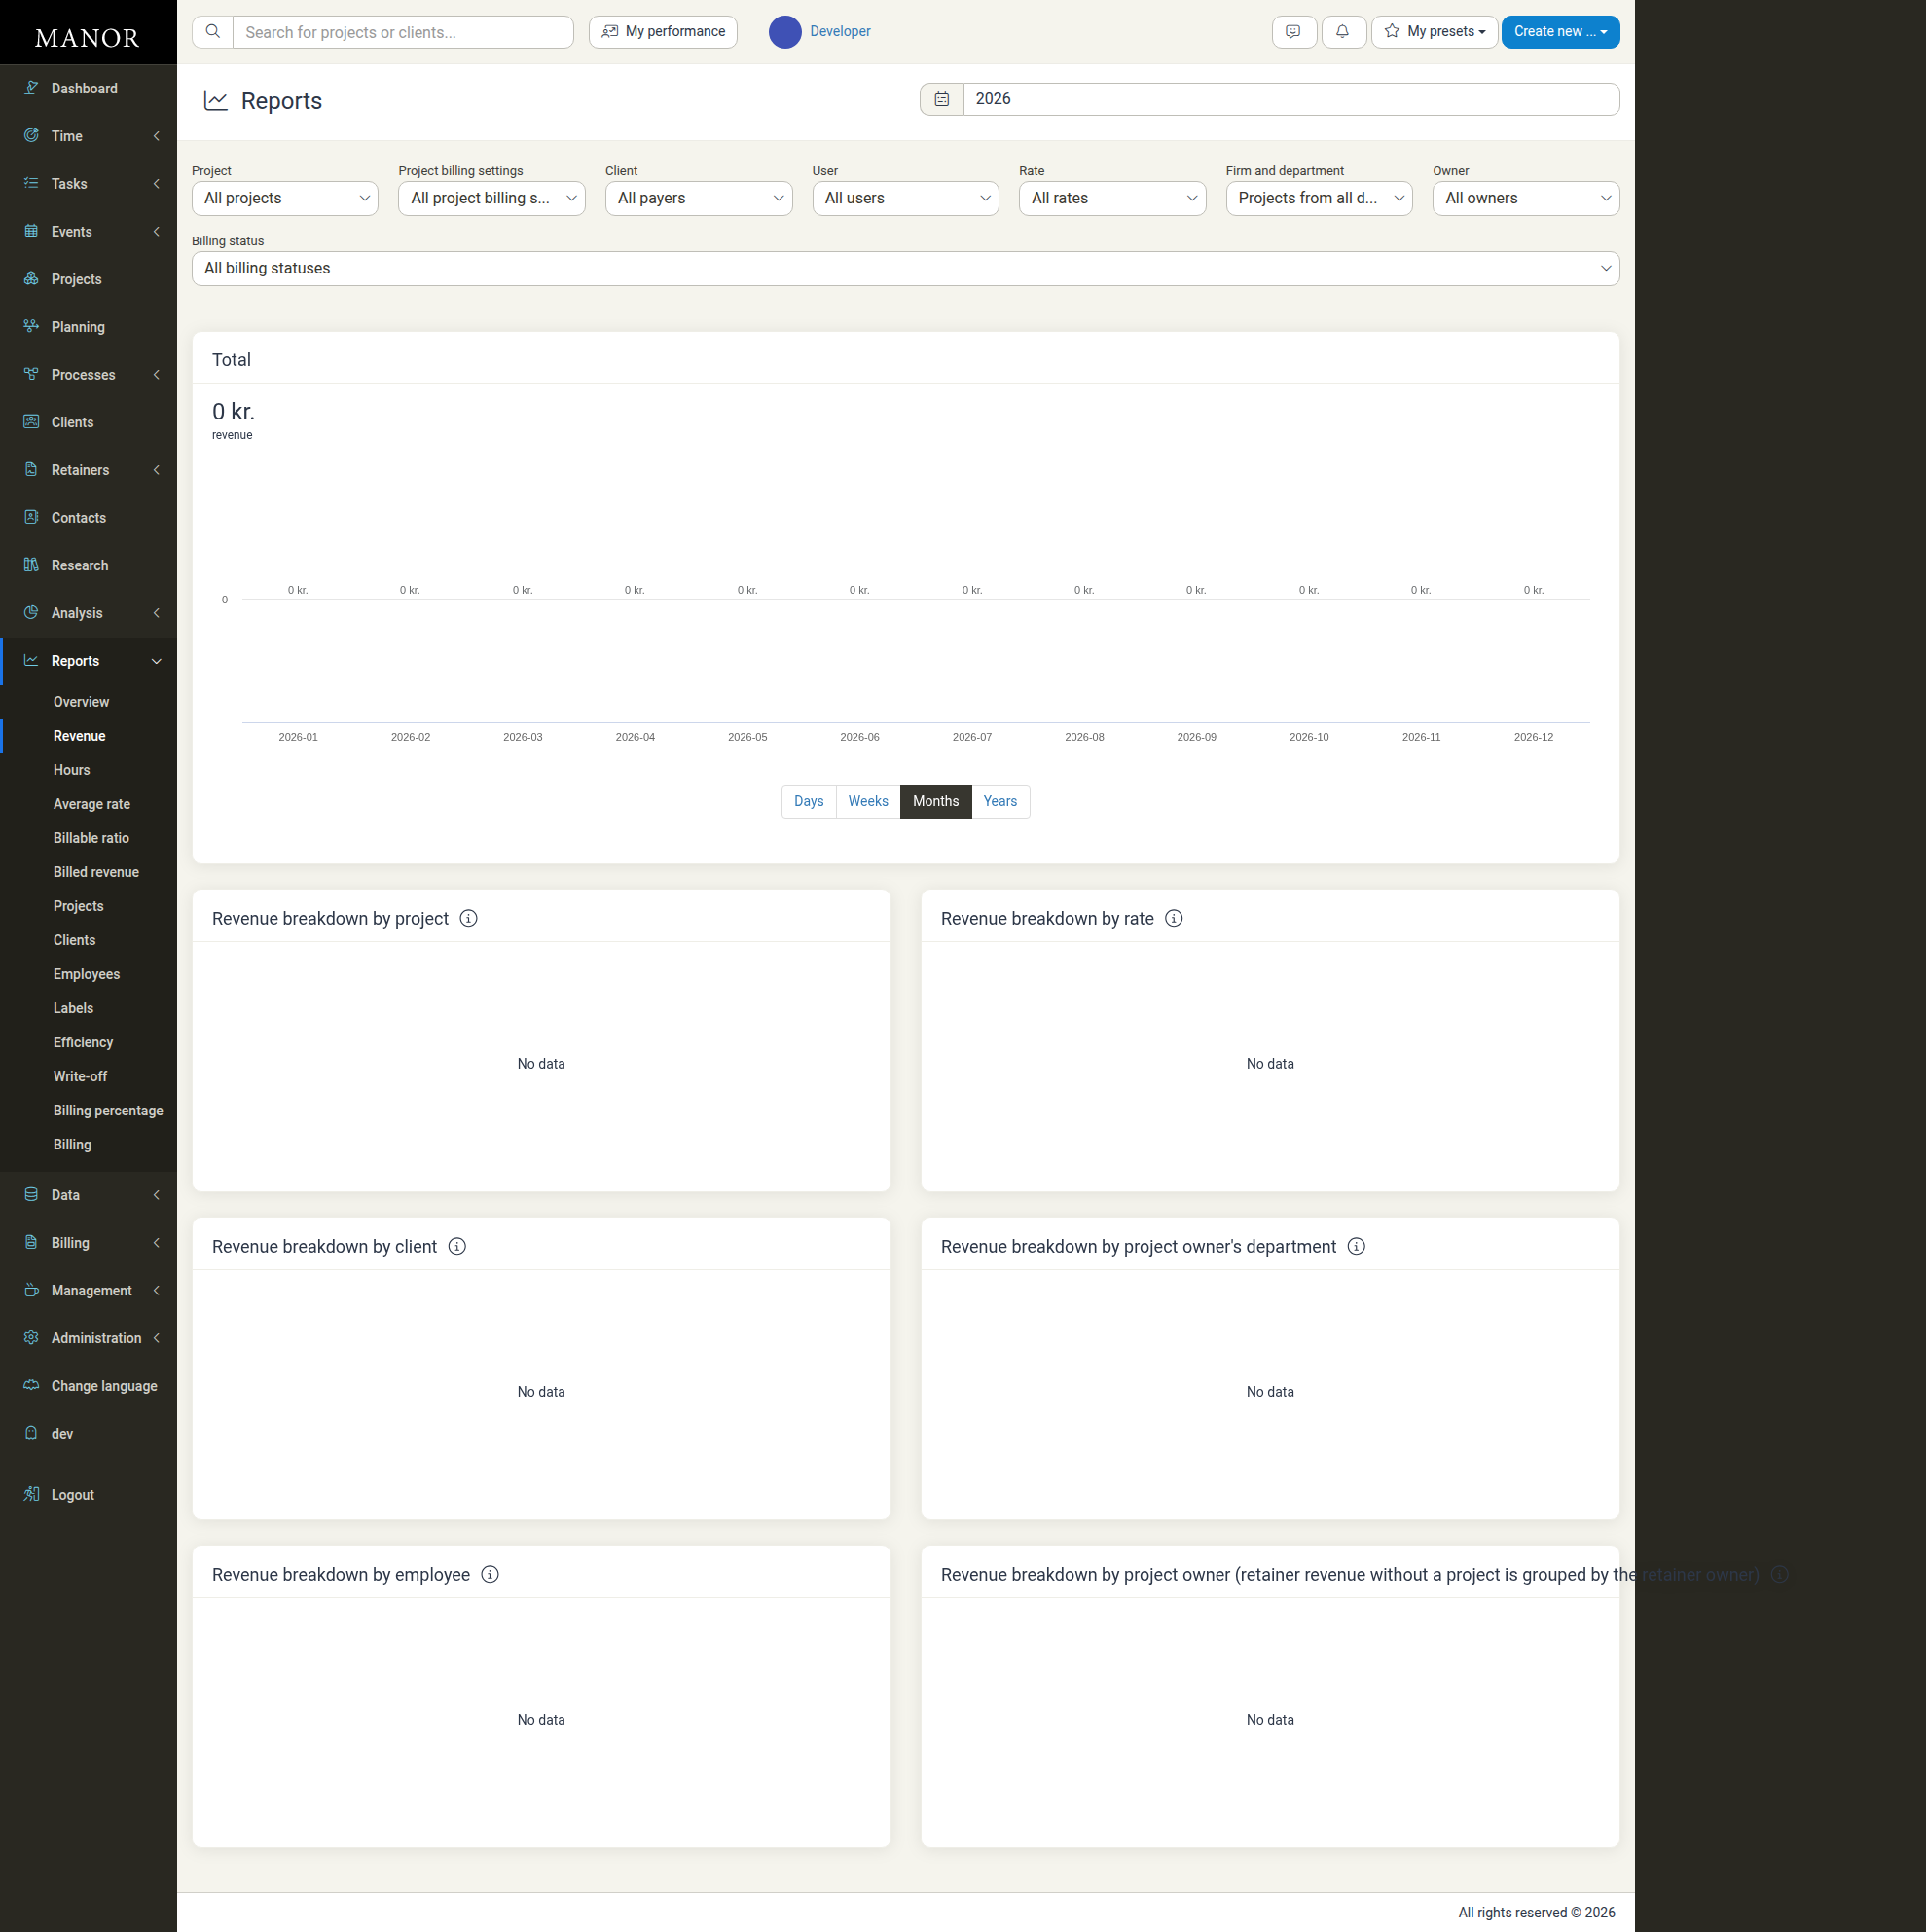
- The report opens for the current year. Use the year selector next to the page title to choose a different year, or open All time, Past, Future, or a custom From/To range, then click Apply.
- Narrow the data with the filter dropdowns at the top of the report. Use Clear filters to reset them.
- Use the Days, Weeks, Months, or Years links below the chart to change how the chart groups the data.
Filters
Most reports share the same filter bar. The exact filters depend on the report, but you typically see:
- Project — Limit the report to one or more projects
- Project billing settings — Filter by how projects are billed
- Client — Limit the report to one or more clients or payers
- User — Show work by a specific employee
- Rate — Filter by billing rate
- Label — Filter by project label
- Firm and department — Filter to a department
- Owner — Filter by project owner
- Billing status — Show all, billed, or unbilled work
Use Clear filters to reset the filter bar, and Show more options / Show fewer options to expand or collapse the full set of filters.
Period and Time Resolution
Each report has a period selector next to its title. The default is the current year, and you can switch to another year, All time, Past, or Future, or set a custom From/To range.
Below the chart on each report, use the Days, Weeks, Months, and Years links to change the chart's time resolution. Months is selected by default.
Exporting Report Data
The Reports pages show charts and summary tables, not raw rows, and they do not have their own Excel export. To work with the underlying numbers in a spreadsheet, export the matching table from the Data section instead. See Exporting Tables to Excel for the steps.
Best Practices
- Set the period first. Choose the year or date range before you read the numbers, so you always know what the report covers.
- Filter before you draw conclusions. Narrow to the client, project, or department you care about, then compare like with like.
- Compare the same metric across reports. Use Revenue and Billed revenue together to see earned versus invoiced revenue, and Billable ratio with Billing percentage to separate billable work from billed work.
- Check the time resolution. Use Months for trends and switch to Weeks or Days when investigating a specific period.
- Keep the data clean. Reports reflect the time entries, billables, and project data that are in Manor, so accurate records give reliable reports.
Related Documentation
- Analysis — Slice live revenue and hours data by any dimension
- Exporting Tables to Excel — Download the underlying records from the Data section
- Data Management — The unified view of all raw records
- Client Work Reports — Generate a single work report covering all work and billables across a client's projects