
The Analysis section provides high-level visual insights into your firm's revenue and billable hours. While the Data section shows individual transactional records (such as time entries, expenses, and products), Analysis aggregates this data into trends and breakdown tables across employees, clients, projects, and departments.
For complete step-by-step instructions, breakdown explanations, and best practices, see the authoritative guide:
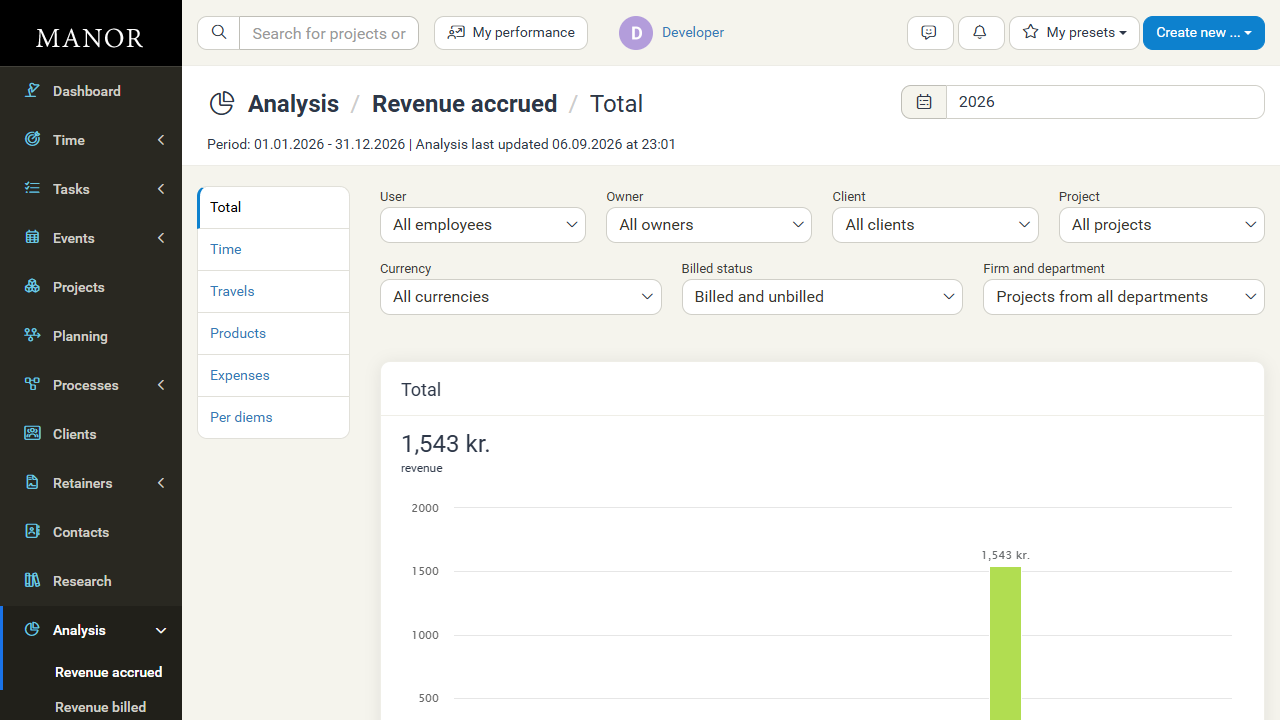
Analysis Views
Analysis is organized into three views, each listed in the Analysis menu:
- Revenue accrued — Tracks the total billable value logged on projects, whether or not it has been invoiced. Use the billable-type tabs to narrow it to Total, Time, Travels, Products, Expenses, or Per diems.
- Revenue billed — Focuses on revenue that has already been invoiced to clients, so you can see how much of the accrued work has been billed. It includes a Debit or credit filter.
- Time — Measures time logged rather than money, with tabs for Hours worked, Billable hours, Billable ratio, Average price, and Same-day rate, plus breakdowns such as time entries by age and time by user role.
Quick Reference: Analysis vs. Data
| Feature | Data Section | Analysis Section |
|---|---|---|
| Primary Scope | Individual records and transactions | Visual trends, aggregations, and charts |
| Key Actions | Search, filter, edit, and export line items | Compare accrued vs. billed revenue, track utilization |
| Output | Record lists and CSV/spreadsheet exports | Interactive charts and breakdown tables |
To explore all raw records, visit Data Management. For formal reports and exports, see Reporting.