
Overview
The top-level Analysis section gives you a visual view of your billable work broken down by revenue accrued, revenue billed, and time. Unlike the Data section, which lists individual transaction records, Analysis aggregates that data into charts and breakdown tables by employee, client, project, department, and more.
Use Analysis to:
- Understand the financial and operational performance of your billable work
- Compare earned (accrued) revenue with invoiced (billed) revenue
- Monitor how hours are allocated across the firm
- Identify your top revenue-generating clients, projects, and team members
Accessing Analysis
- Click Analysis in the main navigation. The submenu expands to show three views.
- Select one of the views:
- Revenue accrued — all logged billables, invoiced and not yet invoiced
- Revenue billed — only what has been invoiced to clients
- Time — hours logged rather than money, with tabs for hours worked, billable hours, billable ratio, average price, and same-day rate
Each view opens on the current calendar year, broken down by month.
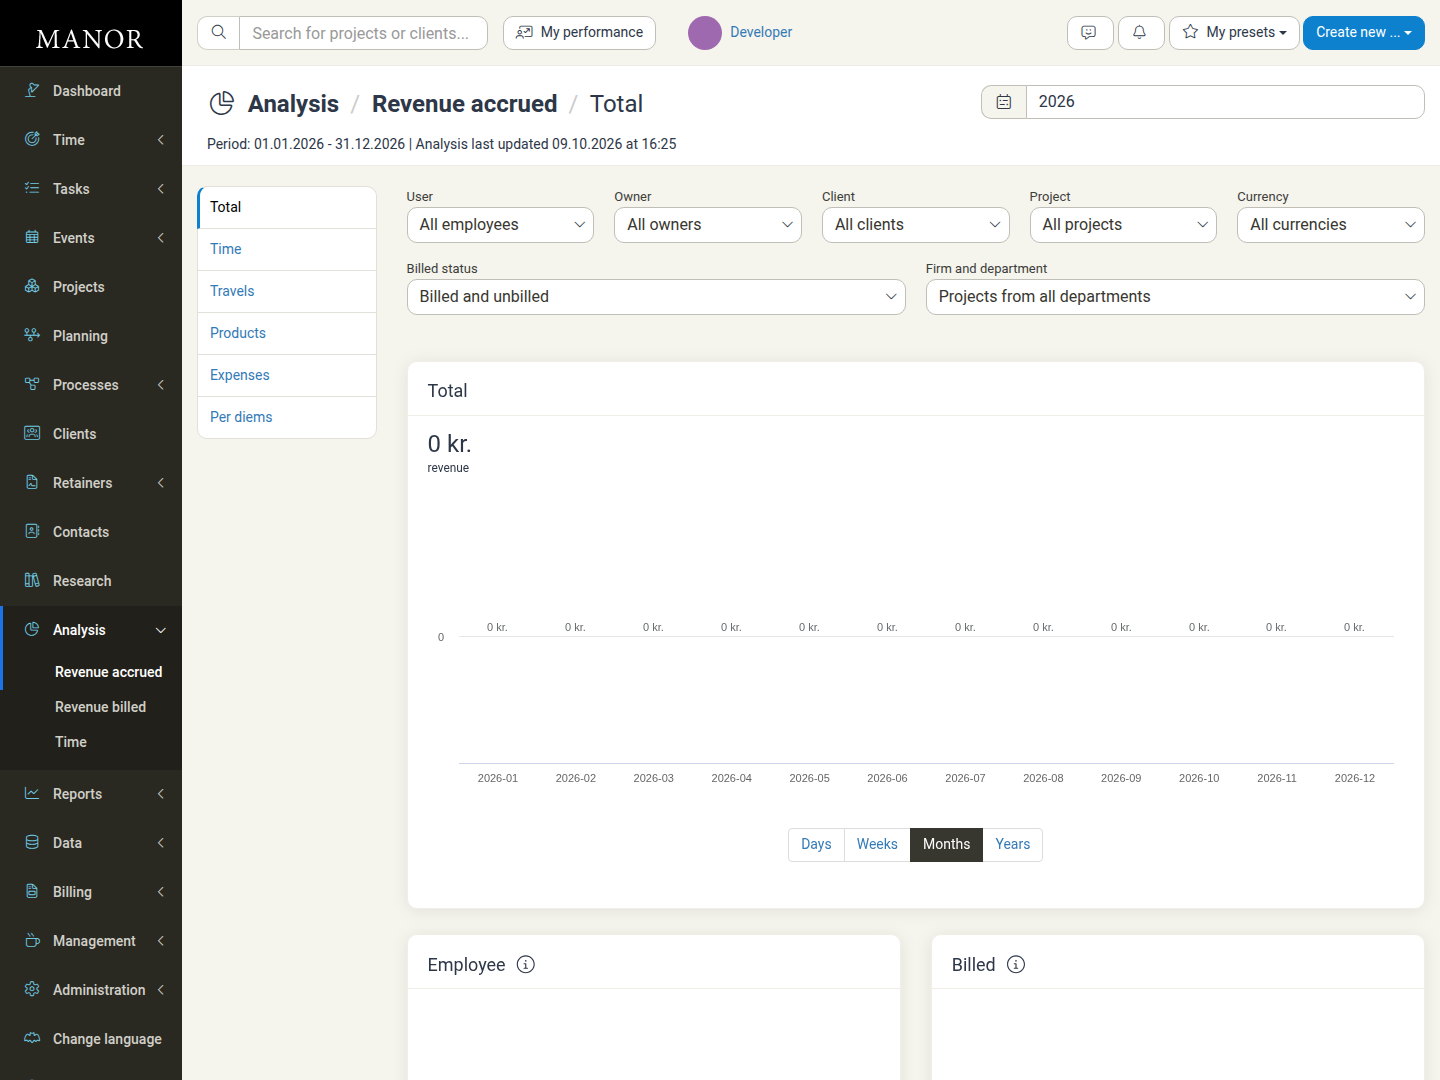
Revenue Accrued
Revenue accrued tracks the value of everything logged to projects, whether or not it has been invoiced. It includes both billed and unbilled work.
Billable type tabs
The tab list at the left of the page switches the whole view between billable types. Total is selected by default.
- Total — all billable types combined
- Time — time entries only
- Travels — travel entries only
- Products — products only
- Expenses — expenses only
- Per diems — per diem entries only
Filters
| Filter | What it does |
|---|---|
| User | Show revenue from a specific employee |
| Owner | Filter by project owner |
| Client | Limit to one or more clients |
| Project | Limit to one or more projects |
| Currency | Filter by billing currency |
| Billed status | Show billed and unbilled, billed only, or unbilled only |
| Firm and department | Filter to a specific firm or department |
Click Clear filters to reset every filter back to its default value.
Total card
The card below the filters shows the total for the current selection and period:
- Total — the headline figure for the selected period and filters
- Chart — the trend across the selected period
- Days / Weeks / Months / Years — the time resolution links below the chart; Months is the default
Breakdown tables
Below the chart, revenue is broken down by:
- Employee — who generated the revenue
- Client — which clients the revenue came from
- Project — which projects contributed
- Currency — revenue split by currency
- Billed — how much is invoiced versus outstanding
- Department — revenue by the project owner's department
- Project owner — who owns the projects generating the revenue
- Billable type — split by time, travel, product, expense, and per diem
Revenue Billed
Revenue billed shows only revenue that has been invoiced to clients. Unbilled work is excluded, so this view reflects your actual billed turnover.
Filters
| Filter | What it does |
|---|---|
| User | Show billed revenue for a specific employee |
| Client | Limit to one or more clients |
| Billable type | Split by time, travel, product, expense, per diem, or retainer |
| Owner | Filter by project owner |
| Debit or credit | Separate credit notes and other credits from regular invoices |
Breakdown tables
Billed revenue is broken down by:
- Employee
- Client
- Billable type — with all retainer revenue grouped as retainer
- Project owner
- Debit or credit — split by invoice type
Key insight: Revenue accrued minus Revenue billed is the value of work that has been logged but not yet invoiced. A persistently large gap points to an invoicing backlog.
Time
Time measures hours logged rather than their monetary value, so you can see how time is spent across the firm.
Time tabs
The tab list at the left of the page switches between time metrics. Hours worked is selected by default.
- Hours worked — total hours logged
- Billable hours — hours logged to billable work
- Billable ratio — the share of logged hours that is billable
- Average price — the average price per logged hour
- Same-day rate — the share of time entries that were registered on the same day as the work
Filters
| Filter | What it does |
|---|---|
| Project | Show time for a specific project |
| Project billing settings | Filter by how the project is billed |
| Client | Show time logged to a specific payer |
| User | Show time logged by a specific employee |
| Rate | Filter by billing rate |
| Firm and department | Filter to a specific firm or department |
| Owner | Filter by project owner |
| Billing status | Show all, billed, or unbilled time |
Breakdown tables
Hours and time entries are broken down by:
- Time breakdown by project — which projects consumed the most hours
- Time breakdown by client — hours per payer
- Time breakdown by employee — individual hour totals
- Time breakdown by rate — hours split by billing rate
- Time breakdown by project owner's department — hours by department
- Time breakdown by project owner — hours grouped by who owns the project
- Time entries by age — the percentage distribution of how many days have passed since each time entry was created, useful for spotting entries written up long after the work was done
- Time by user role — hours split by user role, for example project owners versus other users
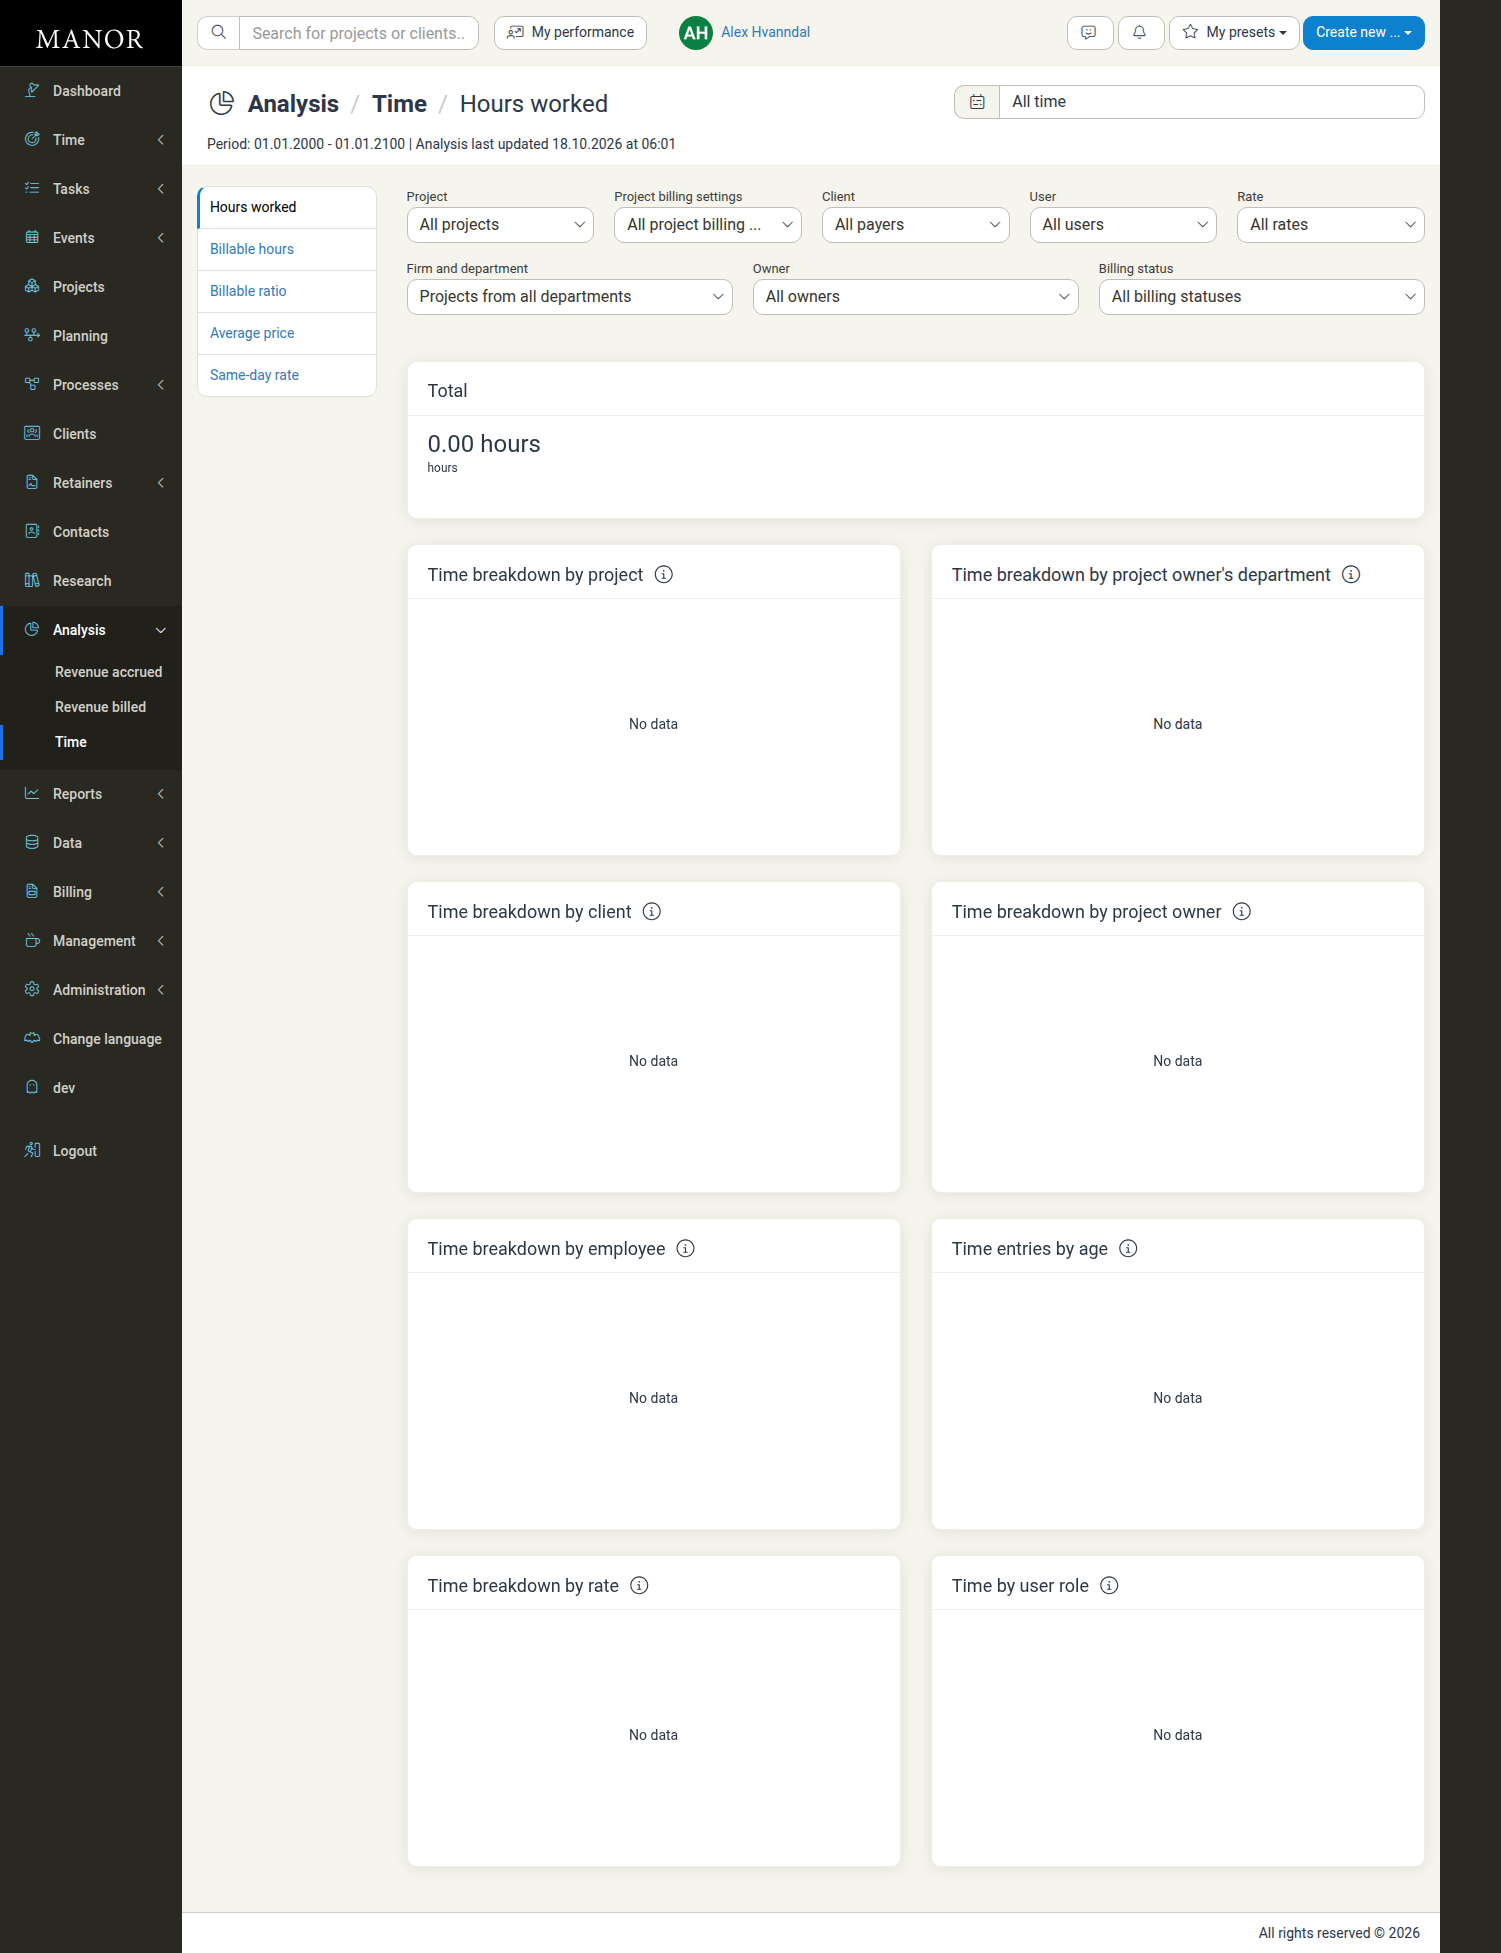
Choosing the Period and Time Resolution
Every Analysis view starts on the current calendar year at monthly resolution.
Change the period
- Click the period selector at the top right of the page, next to the calendar icon.
- In the popover, either type a start and end date in the two date fields, or pick a shortcut: a quick day, month, or relative range under Past or Future, or a specific year.
- Click Apply to reload the view, or Cancel to close without changing anything.
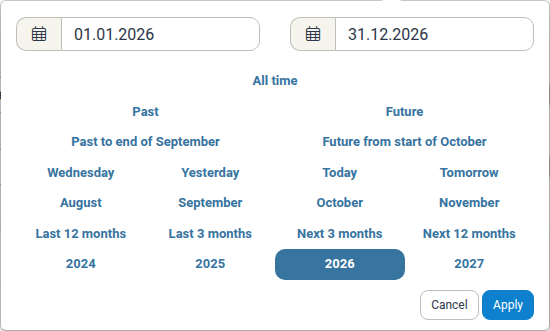
Change the time resolution
- Find the Days / Weeks / Months / Years links directly below the chart.
- Click one to change the grouping.
The chart and every breakdown table update immediately.
Interactive Breakdown Tables
The tables below the chart are more than a summary:
- Click a name in a table to filter the whole view down to that employee, client, project, or other dimension.
- Click the link icon next to a client or project to open that record directly.
- Some tables, such as Billed and Billable type, are read-only summaries and have no drill-down links.
Analysis vs. Data vs. Reports
| Section | Focus | Best for |
|---|---|---|
| Data | Individual transaction records | Detailed auditing, finding specific entries, data maintenance, and spreadsheet exports |
| Analysis | Live charts and aggregations | Quick visual checks, month-to-month trends, spotting top clients and projects |
| Reports | Formal reports and exports | Complex multi-criteria reporting and formal management reporting |
Interpreting Your Data
Accrued versus billed
- Large gap (accrued much higher than billed): work has been completed but not invoiced. Follow up with invoice proposals to protect cash flow.
- Small gap: a prompt invoicing cadence.
- Accrued equals billed: everything logged has been invoiced.
Productivity and utilization
- Use the Hours worked and Billable hours tabs to compare hours per team member.
- Review Time entries by age to see whether employees log time promptly or only at month-end.
- Use Same-day rate together with Time entries by age as a simple measure of logging discipline.
Best Practices
- Filter first, then drill down. Narrow by department or client before clicking into individual breakdown tables.
- Compare accrued and billed side by side. Open both views to spot unbilled balances.
- Check the "Analysis last updated" timestamp. Analysis figures are prepared by a background process, so very recent entries may take a short while to appear.
- Use the right resolution. Monthly for trends, weekly or daily when investigating a specific period.
Troubleshooting
- No data appears: check that your filters are not too restrictive and that the selected period contains logged billables.
- Numbers differ from billing totals: confirm whether you are looking at accrued (includes unbilled) or billed revenue, and check the currency filter on multi-currency data.
- A recent entry is missing: analysis figures are refreshed in the background, so allow a short delay and check the Analysis last updated timestamp.
- An employee or project is missing: verify that billables were logged in the selected period and that no active filter excludes them.
See Also
- Data Management — the Data section, the hub for individual records
- Analysis — short overview of the Analysis section
- Revenue Billed — the Revenue billed report
- Hours Report — detailed hours reporting
- Billable Ratio Report — how the billable ratio is calculated
- Balances Overview — unbilled balances ready for invoicing